// //

Unlocking Free Domain Privacy for Life with Namecheap Coupons -Auto Coupon ADDED

  Free Domain Privacy for Life: Unlocking the Benefits with Namecheap Coupons


In today's digital age, having an online presence is crucial for businesses, bloggers, and individuals alike. One of the first steps towards establishing your online identity is purchasing a domain name. Namecheap, a well-known domain registrar, has been a popular choice for people looking to secure their online real estate affordably. However, Namecheap doesn't stop at just domain registration; they also offer a valuable service that ensures your online privacy – Domain Privacy Protection. In this article, we'll explore the importance of domain privacy, the benefits of using Namecheap, and how you can enjoy free domain privacy for life when you buy a domain from Namecheap using coupons.


Why is Domain Privacy Protection Essential?

When you purchase a domain, your personal information becomes publicly accessible in the WHOIS database, a directory containing contact details of domain owners. This information typically includes your name, physical address, email address, and phone number. Without domain privacy protection, anyone can access this data, exposing you to various risks, such as:


Spam and Unsolicited Communications: With your email address and phone number exposed, you become an easy target for spam emails and unwanted calls from marketers and scammers.


  • Identity Theft: Cybercriminals can use your personal information to impersonate you or engage in identity theft, potentially causing financial and reputational damage.
  • Unwanted Solicitations: Your contact information may be sold to third parties, leading to unwanted solicitations and marketing offers.
  • Privacy Invasion: Individuals seeking to invade your privacy may use your address and phone number for unwelcome visits or harassment.
  • Phishing and Scams: Scammers can craft convincing phishing attempts using your information, making it easier to trick you or others associated with your domain.

Namecheap: A Trusted Domain Registrar


Namecheap has earned a reputation as a trusted and customer-centric domain registrar. Founded in 2000, it has since served millions of customers worldwide, offering a wide range of domain-related services, including web hosting, SSL certificates, and domain privacy protection.


Key Features of Namecheap:

  • Affordability: Namecheap is known for its competitive pricing, making it an excellent choice for individuals and small businesses on a budget.
  • User-Friendly Interface: Their website and domain management dashboard are intuitive and easy to navigate, even for beginners.
  • 24/7 Customer Support: Namecheap provides round-the-clock customer support, ensuring you receive assistance whenever you need it.
  • Free Domain Privacy for the First Year: When you register a domain with Namecheap, you receive free domain privacy protection for the first year, shielding your personal information from public view.
  • Regular Promotions and Coupons: Namecheap frequently offers discounts and coupons, making their services even more cost-effective.


How to Get Free Domain Privacy for Life with Namecheap Coupons

Now, let's delve into the exciting aspect of getting free domain privacy for life when you purchase a domain from Namecheap using coupons.


  • Choose Your Domain: Begin by selecting the domain name you want. Namecheap offers a vast selection of domain extensions, so you can find the perfect one for your website or project.
  • Search for Coupons: Before completing your purchase, take a few moments to search for Namecheap coupons. These coupons can provide discounts, free services, or special offers.
  • Apply the Coupon: When you've found a suitable coupon, apply it during the checkout process. The discount or free service will be automatically reflected in your order total.
  • Complete Your Purchase: After applying the coupon, review your order and complete the payment process. Namecheap accepts various payment methods, including credit cards, PayPal, and cryptocurrency.
  • Enjoy Free Domain Privacy for Life: Thanks to the coupon, you'll not only get the domain at a discounted price but also secure free domain privacy protection for the entire duration of your domain registration.


Benefits of Free Domain Privacy for Life

Securing free domain privacy for life with Namecheap offers numerous advantages:


  • Protect Your Privacy: Your personal information remains confidential, shielding you from spam, scams, and identity theft.
  • Maintain Professionalism: If you're running a business or personal brand, domain privacy protection helps you maintain a professional image by keeping your contact details private.
  • Reduce Unwanted Communications: With your contact information hidden, you'll experience fewer unwanted solicitations, allowing you to focus on your online activities without distractions.
  • Enhance Security: Protecting your data from public access also enhances the security of your online presence, reducing the risk of cyberattacks.
  • Peace of Mind: Knowing that your personal information is safeguarded allows you to concentrate on your website or online venture without worrying about potential privacy breaches.


Apply Coupon Code


Final thoughts

In a digital landscape where online privacy is paramount, Namecheap stands out as a domain registrar committed to protecting your personal information. By taking advantage of Namecheap coupons, you can not only secure your domain at an affordable price but also enjoy free domain privacy for life. This combination of affordability and security makes Namecheap an excellent choice for individuals and businesses looking to establish a strong online presence while safeguarding their personal information.


Remember that while domain privacy protection for the first year is included with your Namecheap domain registration, you can continue to enjoy this crucial service for free by using Namecheap coupons to renew your domain each year. With Namecheap, you can focus on what truly matters – building and maintaining your online presence – without the worry of privacy intrusions. So, go ahead, explore Namecheap's domain offerings, and unlock the benefits of free domain privacy for life today. Your online identity deserves the protection Namecheap provides.

Read More
// //

What is Demand and Supply zone and explain best trading strategy.

 Understanding Demand and Supply Zones in Technical Analysis


Understanding Demand and Supply Zones in Technical Analysis

In the world of trading and technical analysis, one of the fundamental concepts that traders often rely on is the identification of demand and supply zones. These zones play a crucial role in determining potential price movements in various financial markets. In this comprehensive guide, we will delve into the concept of demand and supply zones, explore the rules of plotting them, discuss different types of demand and supply zones, and even touch on demand zones based on time zones.

H1: What are Demand and Supply Zones?

Before we dive into the nitty-gritty details, let's start by understanding what demand and supply zones are and why they matter in technical analysis.

What Are Demand Zones?

Demand zones are price levels or areas on a chart where buying interest exceeds selling pressure, causing prices to rise or reverse direction. These zones are identified as areas where a significant number of buyers are willing to purchase an asset, often due to perceived value or other factors.

What Are Supply Zones?

Conversely, supply zones are price levels or areas where selling pressure outweighs buying interest, leading to a potential price decline or reversal. These zones represent areas where a significant number of sellers are looking to offload their assets.

In essence, demand and supply zones are key areas on a price chart that reflect imbalances in the market. Traders and analysts use these zones to make informed decisions about their trading strategies.


Price Action and Demand/Supply Zones

The concept of demand and supply zones is closely tied to price action, a fundamental aspect of technical analysis. Price action refers to the movement of an asset's price over time as depicted on a chart. It is the raw data of a market and is devoid of any indicators or oscillators.

Price action traders believe that all available information is already reflected in the asset's price, making it the most reliable source of information for making trading decisions. Demand and supply zones are identified through careful analysis of price action, allowing traders to anticipate potential reversals or continuations in price trends.


 Rules of Plotting Demand and Supply Zones

Identifying demand and supply zones requires a systematic approach and adherence to certain rules. Let's explore the essential rules for plotting these zones:

1. Identify Swing Highs and Lows

To begin, you must identify the swing highs and swing lows on the price chart. Swing highs are points where the price temporarily peaks before declining, while swing lows are points where the price bottoms out before rising.

2. Connect the Dots

Next, draw horizontal lines connecting the most recent swing highs and swing lows. These lines form the boundaries of potential demand and supply zones. A zone is created when the price approaches and touches these lines.

3. Observe Price Reactions

As the price approaches a demand or supply zone, carefully observe how it reacts. If the price reverses direction near a zone, it can be considered a strong indicator of the zone's validity.

4. Multiple Timeframe Analysis

To enhance the accuracy of your zones, consider conducting multiple timeframe analysis. This involves examining demand and supply zones on different timeframes, such as daily, hourly, and even minute charts. Zones that align across multiple timeframes are typically more reliable.


Types of Demand and Supply Zones

Demand and supply zones can be categorized into various types based on their characteristics and significance. Here are some common types:

1. Fresh Demand and Supply Zones

Fresh demand and supply zones are areas that have recently formed and have not been retested by the price. Traders often pay close attention to these zones as they are considered strong potential reversal points.

2. Tested Demand and Supply Zones

Tested zones are areas that the price has already revisited once. These zones can still be relevant, but their strength may diminish with each subsequent test.

3. Strong and Weak Zones

Zones can also be classified as strong or weak based on the number of times they have been tested. Strong zones have withstood multiple tests and are considered more reliable, while weak zones may break more easily.


Demand Zones Based on Time Zones

In addition to the conventional understanding of demand and supply zones, some traders incorporate the concept of time zones into their analysis. This approach involves identifying zones based on specific time periods, such as daily, weekly, or monthly.

#1 Daily Demand Zones

Daily demand zones are areas where the price has shown a strong tendency to reverse on a daily chart. Traders often use these zones for intraday trading strategies.

2# Weekly and Monthly Demand Zones

Weekly and monthly demand zones are areas of significant price reversal on longer timeframes. These zones are typically of greater importance to swing traders and investors.


Most Popular Demand and Supply Zones

Among the myriad of demand and supply zones that traders encounter, some stand out as particularly popular and significant. Let's explore two of the most commonly used ones:

1. Support and Resistance Zones

Support zones represent areas where buying interest is expected to be strong, preventing the price from falling further. Conversely, resistance zones are areas where selling pressure is anticipated to be strong, preventing the price from rising further. These zones are essential in technical analysis and are monitored closely by traders.

2. Fibonacci Retracement Zones

Fibonacci retracement zones are levels on a price chart that are based on the Fibonacci sequence. These zones are derived by drawing horizontal lines at key Fibonacci ratios, such as 38.2%, 50%, and 61.8%. Traders often use these zones to identify potential reversal or retracement points.


Demand and supply zone trading strategy Steps 


Indicators and Tools:

  • Daily price chart 

  • Horizontal lines to mark demand and supply zones 

  • Support and resistance lines for confirmation 

  • Risk management plan (stop-loss and take-profit levels)


  • Identify Strong Demand and Supply Zones: Start by analyzing the daily price chart to identify strong demand and supply zones. Look for areas where significant reversals have occurred in the past, especially those with multiple touches.
  • Mark Zones: Draw horizontal lines to mark these zones on your chart. These lines should encompass the price action within the zone.
  • Confirmation: Use support and resistance levels or other technical indicators to confirm the strength of the identified zones. The more confluence you have, the stronger the zone.
  • Entry Point: When the price approaches a demand zone, consider a long (buy) entry, expecting a reversal or bounce. Conversely, when the price nears a supply zone, consider a short (sell) entry, anticipating a reversal or pullback.
  • Risk Management: Implement strict risk management by setting a stop-loss order just below the demand zone for long trades and above the supply zone for short trades. Calculate your position size based on your risk tolerance and the distance to your stop-loss.
  • Take Profit: Determine your take-profit level based on your risk-reward ratio. It's common to set it at a 2:1 or 3:1 ratio, meaning your potential profit should be at least twice or three times your risk.
  • Trail Stops: For more extended trends, consider trailing your stop-loss to lock in profits as the price moves in your favor.
  • Monitor Trade: Keep a close eye on your trade and adjust your stop-loss or take-profit levels as necessary. Be prepared to exit if the price action suggests a change in the trend.
  • Repeat: Continuously scan the markets for new demand and supply zones and repeat the process.


Key Tips:

  • Patience is crucial. Wait for price action to approach your zones before entering a trade.
  • Combine demand and supply zones with other technical analysis tools for added confirmation.
  • Practice proper risk management to protect your capital.

Remember that no trading strategy is foolproof, and there are risks involved in trading. Always use proper risk management and consider paper trading or back testing before implementing any strategy with real capital.


Final Thoughts

Demand and supply zones are fundamental concepts in technical analysis that provide traders with valuable insights into potential price movements. By understanding the rules of plotting these zones and recognizing their different types, traders can make more informed decisions and improve their overall trading strategies.


Whether you are a day trader, swing trader, or long-term investor, incorporating demand and supply zones into your analysis can be a valuable tool for navigating the complex world of financial markets. Remember that while these zones are powerful indicators, they should be used in conjunction with other forms of analysis and risk management strategies to maximize your trading success.

Read More
// //

Mastering Volume Profile: A Comprehensive Guide to Profitable Trading

 Understanding Volume Profile: A Powerful Trading Strategy

Volume profile


In the world of trading, there are countless strategies and tools available to traders, each with its own unique strengths and weaknesses. One such tool that has gained popularity among traders is the Volume Profile. In this comprehensive guide, we will explore what Volume Profile is, how to use it as a trading strategy, and how to make profitable trades with it. By the end of this article, you'll have a solid understanding of Volume Profile and how to integrate it into your trading arsenal.


What is Volume Profile?

Volume Profile is a technical analysis tool used in trading to analyze the distribution of trading volume over a specified time period, typically displayed as a histogram on a price chart. It helps traders visualize where the majority of trading activity has occurred within a given range of prices. This information can be invaluable in making informed trading decisions.

How Does Volume Profile Work?

Volume Profile divides a price chart into price levels or price bins, and for each of these levels, it calculates the total volume traded at that price during the specified time period. These volume values are then plotted as bars or a histogram on the price chart. The result is a graphical representation of the volume distribution across different price levels.

Volume Profile Components

Key Components

  • Point of Control (POC): The price level with the highest traded volume within the specified period is called the Point of Control. It often represents a significant level of interest for traders.
  • Value Area: The Value Area encompasses the price levels where the majority of trading activity occurred, typically covering around 70% of the total volume. It consists of the upper and lower value areas.
  • Volume Nodes: These are price levels where significant volume has traded, but they may not necessarily fall within the Value Area. Volume Nodes can act as support or resistance levels.


Visual Representation : Volume Profile Chart


Benefits of Using Volume Profile

Before delving into how to use Volume Profile as a trading strategy, it's essential to understand its advantages:

  • Enhanced Decision-Making: Volume Profile provides a clear visual representation of support and resistance levels based on trading activity, helping traders make informed decisions.
  • Customizable Timeframes: Traders can adapt Volume Profile to different timeframes, making it suitable for various trading styles, from day trading to long-term investing.
  • Objective Analysis: Unlike some subjective technical analysis tools, Volume Profile relies on objective data, making it a valuable tool for traders seeking data-driven insights.


Volume Profile Trading Strategies

1. Identifying Key Levels

Volume Profile can help traders identify crucial price levels, including:

Point of Control (POC): This level often serves as a point of interest for traders, as it represents the highest traded volume and may act as support or resistance.

Value Area: The upper and lower boundaries of the Value Area can also act as support and resistance levels. Breakouts from these areas can be significant trading opportunities.


2. Volume-Based Entries

Traders can use Volume Profile to time their entries by looking for confirmation of support or resistance at key levels. For example, a trader might enter a long position if the price bounces off a Volume Node within the Value Area.


3. Volume Profile and Price Patterns

Volume Profile can be combined with traditional price patterns like head and shoulders, flags, or triangles. Traders look for these patterns within the context of Volume Profile to enhance their trading decisions.


Putting Volume Profile into Practice


Step-by-Step Guide

Now that we understand the basics of Volume Profile and its potential benefits, let's discuss how to use it effectively in your trading strategy.


1. Select a Timeframe

Start by selecting the timeframe that aligns with your trading goals. Short-term traders may use intraday charts, while long-term investors might opt for daily or weekly charts.

2. Plot the Volume Profile

Add the Volume Profile indicator to your trading platform and apply it to your selected timeframe. This will create the histogram on your price chart.

3. Identify Key Levels

Locate the Point of Control (POC) and the Value Area on your chart. These are the primary areas of interest where you'll be focusing your analysis.

4. Look for Entry Opportunities

When the price approaches the POC or significant Volume Nodes within the Value Area, look for confirmation signals such as candlestick patterns or trend indicators. This can be an excellent time to enter a trade.

5. Set Stop-Loss and Take-Profit Levels

Always use risk management tools like stop-loss orders to limit potential losses. Determine your take-profit levels based on the potential price targets identified by Volume Profile.

6. Monitor Trade Progress

Keep a close eye on your trade as it progresses. If the price reaches your take-profit level or violates your stop-loss, be prepared to exit the trade.


Common Mistakes and Tips

Common Mistakes to Avoid

  • Ignoring Risk Management: Failing to use stop-loss orders can lead to significant losses when trading with Volume Profile.
  • Overcomplicating Analysis: It's easy to become overwhelmed by excessive technical indicators. Stick to the basics and use Volume Profile as a complementary tool.
  • Neglecting Fundamental Analysis: Volume Profile is a valuable technical tool, but it should not replace fundamental analysis when making trading decisions.


Tips for Successful Volume Profile Trading

  • Practice Patience: Wait for clear confirmations at key levels before entering a trade.
  • Backtest Your Strategy: Test your Volume Profile strategy on historical data to assess its viability.
  • Continuous Learning: Stay updated with new developments in Volume Profile techniques and market conditions.


Final Thoughts

Volume Profile is a versatile and data-driven trading tool that can significantly enhance your trading strategy. By understanding its components, benefits, and how to use it effectively, you can improve your ability to identify profitable trading opportunities and manage risk. Remember that like any trading strategy, mastering Volume Profile takes time, practice, and ongoing education. With dedication and discipline, you can integrate Volume Profile into your trading toolkit and work towards achieving your trading goals.

Read More
// //

Unlocking the Secrets of the Falling Wedge Pattern in Trading

Understanding the Falling Wedge Pattern in Trading

Understanding the Falling Wedge Pattern in Trading


In the world of technical analysis, the falling wedge pattern is a valuable tool that traders use to identify potential trend reversals or continuations. This comprehensive guide aims to provide traders, both novice and experienced, with an in-depth understanding of the falling wedge pattern. We'll explore its definition, various types, strategies for trading it, and key price action dynamics, including entry and exit points. Additionally, we'll discuss the best indicators to use when working with this pattern to enhance your trading success.


What is a Falling Wedge Pattern?

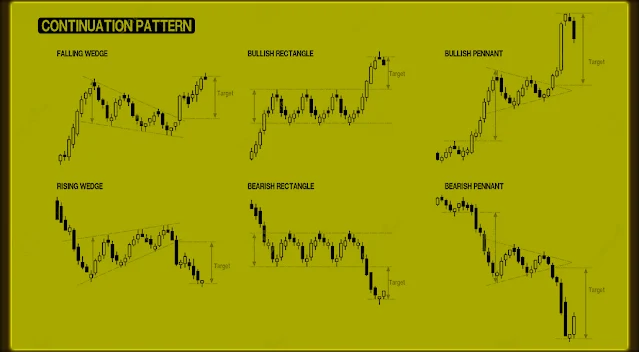
The falling wedge pattern is a technical analysis pattern that typically occurs within a downtrend and signifies a potential reversal of that trend. It is characterized by two converging trendlines: a descending resistance line and a shallower descending support line. The price movement within these lines creates a narrowing pattern resembling a wedge.


 Anatomy of a Falling Wedge Pattern

To grasp the falling wedge pattern, let's break down its key components:

1)  Resistance Trendline

The resistance trendline connects the lower swing highs within the pattern. It has a steeper descending slope compared to the support trendline.

2) Support Trendline

The support trendline connects the lower swing lows within the pattern. It slopes downward but at a shallower angle than the resistance trendline.

3) Gradual Convergence

One prominent feature of a falling wedge pattern is the gradual convergence of the two trendlines, leading to a narrowing price range.


Types of Falling Wedge Patterns

While the fundamental structure of a falling wedge pattern remains consistent, variations occur based on different timeframes and market conditions. Understanding these variations is vital for effective trading.

 1) Short-Term Falling Wedge

A short-term falling wedge pattern unfolds over a relatively brief period, often intraday or on shorter timeframes. Traders may use this pattern for short-term trading strategies.

2) Long-Term Falling Wedge

Conversely, a long-term falling wedge pattern develops over an extended period, such as weeks or months. It is particularly relevant for swing traders and investors looking at broader market trends.


Understanding Falling Wedge Pattern Price Action

Understanding the price action within a falling wedge pattern is essential for making well-informed trading decisions. Let's explore the price dynamics and key elements.


Formation Criteria

Before diving into price action, it's crucial to understand the formation criteria of a falling wedge pattern. These criteria provide the context for interpreting price movements.


 Multiple Touches

A valid falling wedge pattern typically features multiple touches on both the support and resistance trendlines. These touches confirm the pattern's validity and suggest that market participants recognize its significance.

Gradual Slope

While the slope of the trendlines within a falling wedge can vary slightly, a gradual slope is generally more reliable. An excessively steep slope may indicate an unsustainable trend.


Price Action within the Falling Wedge Pattern

Now, let's delve into the price action dynamics that occur within a falling wedge pattern:

1) Converging Trendlines

The most notable feature of a falling wedge pattern is the convergence of the support and resistance trendlines. These lines progressively approach each other, creating a narrowing price range that signifies potential price compression.

2)Lower Highs and Lower Lows

Within the falling wedge, you'll observe a sequence of lower highs and lower lows. These price movements reflect the tug-of-war between buyers and sellers:

  • Lower Highs: These points signify that sellers are prevailing, as the market fails to reach or exceed the previous high.
  • Lower Lows: These points represent a continuation of the downtrend, indicating that sellers are maintaining control.

3) Declining Volume

Another crucial aspect of falling wedge pattern price action is volume. As the pattern develops, trading volume typically decreases. This decline suggests diminishing market participation and is often seen as a precursor to a potential breakout.

  • Volume Analysis: Keep a close watch on volume levels. A pronounced decrease in volume within the pattern may serve as a cautionary signal, indicating that a breakout is impending.

4) Psychological Factors

Price action within a falling wedge pattern can also be influenced by psychological factors. Traders and investors are aware of the pattern's implications, which can lead to specific behaviors:

  • Anticipation: As the pattern approaches its apex (the point of convergence), traders become increasingly anticipatory. They recognize that a breakout is imminent and may position themselves accordingly.
  • Buyer Interest: Some traders may start accumulating positions near the support trendline in anticipation of a bullish breakout. This buying interest can contribute to a potential reversal.


 Interpretation and Potential Outcomes

Interpreting the price action within a falling wedge pattern involves assessing the balance of forces between buyers and sellers and anticipating potential outcomes:


Bullish Bias

Despite being formed within a downtrend, the falling wedge pattern often suggests a bullish bias:

  • Lower Highs and Lower Lows: The formation of lower highs and lower lows indicates a weakening downtrend and suggests a potential shift in sentiment.
  • Converging Trendlines: The convergence of the support and resistance trendlines signals that the price is experiencing a narrowing range, which could lead to a breakout.


Potential Outcomes

  • Bullish Breakout: The most common outcome of a falling wedge pattern is a bullish breakout. This occurs when the price breaks above the resistance trendline. Traders interpret this as a sign that the downtrend is losing momentum, and a potential reversal to the upside is underway.
  • False Breakout: Occasionally, the price may briefly breach the resistance trendline but then quickly reverse and return within the wedge pattern. This is known as a false breakout and can trap traders who entered long positions prematurely.
  • Continuation: In some instances, the price may break below the support trendline, signaling a continuation of the existing downtrend. However, this outcome is less common and often requires strong bearish catalysts.


How to Trade the Falling Wedge Pattern

Trading the falling wedge pattern effectively involves specific strategies and tactics to maximize potential profits while managing risks. Let's explore these strategies, including entry and exit points:

Trading the Bullish Breakout

When anticipating a bullish breakout based on the price action within a falling wedge pattern, consider the following strategies:

1) Entry Points

  • Confirmation: Wait for a confirmed breakout above the resistance trendline. Avoid entering long positions prematurely.
  • Limit Orders: Utilize limit orders to enter the market at a predetermined price level after the breakout.

2) Stop-Loss and Take-Profit Levels

  • Stop-Loss: Place stop-loss orders just below the breakout point to limit potential losses if the breakout proves to be false.
  • Take-Profit: Calculate potential price targets based on the width of the wedge pattern (the distance between the support and resistance trendlines). Consider taking partial profits as the price approaches these targets.


3) Risk Management

  • Position Size: Determine your position size based on your risk tolerance and the distance to your stop-loss.
  • Diversification: Avoid concentrating your risk in a single trade. Diversify your trading portfolio across different assets and strategies.


 Dealing with False Breakouts

False breakouts can occur and lead to losses. Here's how to manage them:

1) Wait for Confirmation

  • Confirmation Indicators: Use confirmation indicators such as volume and momentum oscillators to validate the authenticity of the breakout.

2) Be Patient

Avoid Impulsiveness: Exercise patience and avoid rushing into trades. A failed breakout may provide another opportunity to enter the market at a more favorable price.

 Best Indicator for Falling Wedge Pattern

Using the right indicators can significantly enhance your analysis and decision-making when trading the falling wedge pattern. Here are some of the best indicators to consider:

 1) Relative Strength Index (RSI)

The RSI is a momentum oscillator that measures the speed and change of price movements. It ranges from 0 to 100 and is particularly useful in identifying overbought and oversold conditions. When trading a falling wedge pattern, look for divergence between the RSI and the price action. Bullish divergence can be a strong signal of a potential bullish breakout.

2) Moving Averages

Moving averages smooth out price data to create a trend-following indicator. The 50-period and 200-period moving averages are commonly used to identify trend directions. In the context of a falling wedge pattern, a bullish crossover, where the shorter-term moving average crosses above the longer-term moving average, can provide additional confirmation of a bullish breakout.

 3) Volume

Volume is a critical indicator when trading the falling wedge pattern. As mentioned earlier, declining volume within the pattern can be a warning sign of an impending breakout. Pay close attention to volume surges during the breakout, as it can validate the strength and authenticity of the move.


Entry and Exit Points in Falling Wedge Pattern

Identifying the right entry and exit points is crucial when trading the falling wedge pattern. Here are some guidelines:

1) Entry Points

  • Confirm the Breakout: Wait for a confirmed breakout above the resistance trendline for a bullish entry. Avoid entering prematurely.
  • Use Limit Orders: Place limit orders slightly above the resistance trendline to enter the market at a predetermined price level once the breakout occurs.

2)  Exit Points

  • Take Partial Profits: As the price approaches potential targets (based on the width of the pattern), consider taking partial profits to secure gains while allowing the remainder of the position to run.
  • Adjust Stop-Loss: Adjust your stop-loss order to lock in profits as the trade moves in your favor. This helps protect against reversals.


Final Thought

The falling wedge pattern is a valuable tool for traders seeking to identify potential trend reversals or continuations within a downtrend. By understanding its structure, formation criteria, breakout strategies, and key indicators, you can make more informed trading decisions. Remember to implement risk management techniques, be cautious of false breakouts, and continuously refine your trading skills. With practice and dedication, you can harness the power of the falling wedge pattern to enhance your trading success and navigate the complex world of financial markets with confidence.

Read More
// //

Mastering the Rising Wedge Pattern: Types, Trading Strategies, and Best Indicators

  Mastering the Rising Wedge Pattern in Trading

Mastering the Rising Wedge Pattern in Trading


In the world of technical analysis, the rising wedge pattern is a powerful tool for traders seeking to identify potential trend reversals and make informed decisions. This article is your comprehensive guide to understanding the rising wedge pattern, its types, and strategies for trading it effectively. We'll delve into the basics, explore various types, discuss key indicators, and provide practical insights for traders at all levels.


What is a Rising Wedge Pattern?

A rising wedge pattern is a technical analysis pattern that occurs within an uptrend and typically signals a potential trend reversal. This pattern is characterized by two converging trendlines: an upward-sloping support line and a steeper upward-sloping resistance line. As the price oscillates within these lines, it creates a narrowing formation resembling a wedge.


Anatomy of a Rising Wedge Pattern

To understand the rising wedge pattern, let's break down its key components:

A) Support Trendline

The support trendline connects the higher swing lows within the pattern. It slopes upward but at a less steep angle than the resistance trendline.

B) Resistance Trendline

The resistance trendline connects the higher swing highs within the pattern. It has a steeper upward slope compared to the support trendline.

C) Gradual Convergence

One distinctive feature of a rising wedge pattern is the gradual convergence of the two trendlines, creating a narrowing price range.

Types of Rising Wedge Patterns

While the basic structure of a rising wedge pattern remains the same, variations exist based on the timeframes and market conditions. Understanding these variations is essential for effective trading.

I) Short-Term Rising Wedge

A short-term rising wedge pattern occurs over a relatively brief period, such as intraday or on shorter timeframes. Traders often use this pattern for short-term trading strategies.

II) Long-Term Rising Wedge

Conversely, a long-term rising wedge pattern develops over an extended period, often spanning weeks or months. It is particularly relevant for swing traders and investors.


Understanding Rising Wedge Pattern Price Action

Understanding the price action within a rising wedge pattern is essential for traders looking to make informed decisions. In this section, we will explore the dynamics of rising wedge pattern price action and how to interpret it effectively.


Formation Criteria

Before delving into price action, it's crucial to review the formation criteria of a rising wedge pattern, as they provide context for its price behavior.

 A) Multiple Touches

One key characteristic of a valid rising wedge pattern is that both the support and resistance trendlines should have multiple touches. These touches indicate that market participants are acknowledging these levels as significant.

B)  Gradual Slope

While the slope of the trendlines within a rising wedge pattern can vary, a gradual slope is generally more reliable. An overly steep slope may signal an unsustainable trend.


 Price Action within the Rising Wedge Pattern

Now, let's delve into the price action dynamics that occur within a rising wedge pattern:


A) Converging Trendlines

The most conspicuous feature of a rising wedge pattern is the convergence of the support and resistance trendlines. These lines come together, creating a narrowing price range resembling a wedge. This narrowing range suggests a potential decrease in price volatility as the pattern progresses.


 B) Lower Highs and Higher Lows

Within the rising wedge, you'll observe a sequence of lower highs and higher lows. These fluctuations in price represent a tug-of-war between buyers and sellers.

  • Lower Highs: These are price points where the market fails to reach or exceed the previous high. It indicates that buyers are becoming less enthusiastic and that selling pressure may be building.
  • Higher Lows: These are price points where the market fails to reach or exceed the previous low. It suggests that sellers are losing momentum and that buying interest may still exist.


C) Declining Volume

Another critical aspect of rising wedge pattern price action is the volume. Typically, as the pattern develops, trading volume tends to decrease. This declining volume reflects a decrease in market interest and participation.

  • Volume Analysis: Pay close attention to volume levels. A sharp decrease in volume within the pattern is often seen as a cautionary signal. It implies that the market is in a state of uncertainty, and a breakout might be approaching.

D) Psychological Factors

The price action within a rising wedge pattern can also be influenced by psychological factors. Traders and investors are aware of the pattern's implications, which can lead to specific behaviors:

  • Caution: As the pattern progresses and the price approaches the apex (the point where the trendlines converge), traders become cautious. They are aware that a breakout is imminent and may hesitate to enter new positions.
  • Pressure to Breakout: Traders anticipating a breakout may exert pressure on the price. Those expecting a bullish breakout may start buying near the support trendline, while those expecting a bearish breakout may start selling near the resistance trendline.


 Interpretation and Potential Outcomes

Interpreting the price action within a rising wedge pattern involves assessing the balance of forces between buyers and sellers and anticipating potential outcomes:

A)  Bearish Bias

The overall price action and structural characteristics of a rising wedge pattern often suggest a bearish bias:

  • Lower Highs: The consecutive lower highs indicate weakening buying interest.
  • Narrowing Range: The converging trendlines signify a potential compression of price movement.
  • Declining Volume: Reduced trading volume hints at waning market enthusiasm.

B) Potential Outcomes

  • Bearish Breakout: The most common outcome of a rising wedge pattern is a bearish breakout. This occurs when the price breaks below the support trendline. Traders interpret this as a signal that the uptrend is losing momentum, and a potential reversal to the downside is underway.
  • False Breakout: Sometimes, the price may temporarily break below the support trendline but then quickly reverse and return within the wedge pattern. This is known as a false breakout and can trap traders who entered short positions prematurely.
  • Continuation: In some cases, the price may break above the resistance trendline, indicating a continuation of the existing uptrend. However, this outcome is less common and often requires strong bullish catalysts.


 Trading Strategies Based on Rising Wedge Price Action

Now that we've gained a deeper understanding of rising wedge pattern price action, let's explore trading strategies that leverage this knowledge:

Trading the Bearish Breakout

When anticipating a bearish breakout based on the price action within a rising wedge pattern, consider the following strategies:

A) Entry Points

  • Confirmation: Wait for a confirmed breakout below the support trendline. Avoid entering short positions prematurely.
  • Limit Orders: Utilize limit orders to enter the market at a predetermined price level after the breakout.


B) Stop-Loss and Take-Profit Levels

  • Stop-Loss: Place stop-loss orders just above the breakout point to limit potential losses if the breakout proves to be false.
  • Take-Profit: Calculate potential price targets based on the width of the wedge pattern (the distance between the support and resistance trendlines). Consider taking partial profits as the price approaches these targets.


Risk Management

  • Position Size: Determine your position size based on your risk tolerance and the distance to your stop-loss.
  • Diversification: Avoid concentrating your risk in a single trade. Diversify your trading portfolio across different assets and strategies.


Dealing with False Breakouts

False breakouts are common in trading and can lead to losses. Here's how to manage them:

Wait for Confirmation

  • Confirmation Indicators: Use confirmation indicators such as volume and momentum oscillators to validate the authenticity of the breakout.

Be Patient

  • Avoid Impulsiveness: Exercise patience and avoid rushing into trades. A failed breakout may provide another opportunity to enter the market at a more favorable price.

 How to Trade the Rising Wedge Pattern


Trading the rising wedge pattern requires a well-defined strategy and an understanding of potential breakout directions.


Breakout Direction

Determining the breakout direction is a critical aspect of trading the rising wedge pattern.

Bearish Breakout

A bearish breakout occurs when the price breaks below the support trendline of the rising wedge. Traders interpret this as a sign that the prevailing uptrend is losing momentum, and a potential reversal to the downside is underway.


Confirmation Indicators

To enhance the accuracy of your breakout prediction, consider using confirmation indicators:

Momentum Indicators: Indicators like the Relative Strength Index (RSI) or the Moving Average Convergence Divergence (MACD) can help confirm the strength of the breakout signal.

Volume: Look for an increase in trading volume during the breakout, as it can validate the authenticity of the breakout.

Trading Strategies

Trading the rising wedge pattern involves specific strategies to maximize potential profits while managing risks.

 Entry Points

  • Wait for a confirmed breakout: Avoid premature entries by waiting for the price to decisively break below the support trendline.
  • Set entry orders: Utilize limit orders to enter the market at a predetermined price level after a confirmed breakout.
  • Implement stop-loss orders: Protect your capital by placing stop-loss orders just above the breakout point to limit potential losses.
  • Consider trailing stop-loss: As the price moves in your favor, adjust your stop-loss to lock in profits while protecting against reversals.

Take-Profit Levels

  • Calculate price targets: Measure the width of the rising wedge pattern, which is the distance between the support and resistance trendlines.
  • Apply the width to the breakout point: For a bearish breakout, subtract the width from the breakout point to estimate the potential downside target.
  • Take partial profits: Consider scaling out of your position as the price approaches the target to secure some gains while allowing the remainder to run.

Risk Management

  • Effective risk management is essential when trading the rising wedge pattern:
  • Determine your position size based on your risk tolerance and the distance to your stop-loss.
  • Avoid risking more than a predetermined percentage of your trading capital on a single trade.
  • Diversify your trading portfolio to spread risk across different assets and strategies.

Best Indicator for Rising Wedge Pattern

While trading the rising wedge pattern, using the right indicators can significantly enhance your analysis and decision-making process.

 1) Relative Strength Index (RSI)

The RSI is a momentum oscillator that measures the speed and change of price movements. It ranges from 0 to 100 and is particularly useful in identifying overbought and oversold conditions. When trading a rising wedge pattern, look for divergence between the RSI and the price action. Bearish divergence can be a strong signal of a potential bearish breakout.

2) Moving Averages

Moving averages smooth out price data to create a trend-following indicator. Traders often use the 50-period and 200-period moving averages to identify trend directions. In the context of a rising wedge pattern, a bearish crossover, where the shorter-term moving average crosses below the longer-term moving average, can provide additional confirmation of a bearish breakout.

3) Volume

Volume is an essential indicator when trading the rising wedge pattern. As mentioned earlier, declining volume within the pattern can be a warning sign of an impending breakout. Pay close attention to volume surges during the breakout, as it can validate the strength and authenticity of the move.


Final Thought

The Rising wedge pattern is a valuable tool for traders seeking to identify potential trend reversals within an uptrend. By understanding its structure, formation criteria, breakout strategies, and key indicators, you can make more informed trading decisions. Remember to implement risk management techniques, be cautious of false breakouts, and continuously refine your trading skills. With practice and dedication, you can harness the power of the rising wedge pattern to enhance your trading success.

Read More
// //

Mastering Wedge Chart Patterns: Trading Strategies and Type

A Comprehensive Guide to Wedge Chart Patterns in Trading


In the dynamic world of trading, technical analysis is a valuable tool that helps traders make informed decisions. Among the plethora of chart patterns, the wedge pattern stands out as a powerful indicator of potential trend reversals or continuations. Whether you're a seasoned trader or just starting, understanding the wedge chart pattern can significantly enhance your trading strategy. In this comprehensive guide, we will delve deep into the world of wedge patterns, from their definition and types to strategies for trading them effectively.


What is a Wedge Chart Pattern?

A wedge chart pattern is a technical analysis pattern that represents a temporary pause or consolidation within a prevailing trend. It is characterized by two converging trendlines, one sloping up (rising wedge) and the other sloping down (falling wedge). The price movement within these converging trendlines indicates potential future price action.

Types of Wedge Patterns

Wedge patterns can be broadly categorized into two main types, each with its own implications for traders:

1) Rising Wedge

A rising wedge is a bearish pattern that occurs during an uptrend. It is characterized by a sloping resistance line and a steeper sloping support line. As the price oscillates within these lines, it creates a narrowing pattern, suggesting that the uptrend is losing steam. Traders often see this as a warning sign of a potential trend reversal to the downside.

2) Falling Wedge

Conversely, a falling wedge is a bullish pattern found in a downtrend. It consists of a descending resistance line and a shallower sloping support line. The narrowing price movement within these lines indicates a potential breakout to the upside, signaling a reversal of the prevailing downtrend.


Understanding Wedge Pattern Price Action

I) Formation Criteria

To effectively identify and trade wedge patterns, it's essential to understand the criteria for their formation:

A) Trendlines

The foundation of a wedge pattern lies in the two converging trendlines. Here's how to correctly draw and interpret them:

  • Resistance Trendline: Connects the higher swing highs in a rising wedge or the lower swing highs in a falling wedge.
  • Support Trendline: Connects the lower swing lows in a rising wedge or the higher swing lows in a falling wedge.

For a valid wedge pattern, these trendlines should intersect at a specific point known as the apex. The slope of these trendlines is generally gradual but noticeable.

B) Multiple Touches

A robust wedge pattern typically features multiple touches on both the support and resistance trendlines. These touches confirm the validity of the pattern and suggest that market participants are paying attention to these levels.

C) Gradual Slope

While the slope of the trendlines can vary, a gradual slope is often considered more reliable. A steep slope may indicate a more aggressive trend, but it could also lead to false breakouts.

II. Volume

Volume analysis is a crucial component of trading wedge patterns. Typically, as the wedge pattern develops, trading volume tends to decrease. This decline in volume signifies decreasing market interest and can serve as a warning sign of an impending breakout.


How to Trade Wedge Chart Patterns

Now that we've covered the basics of wedge patterns let's explore strategies for trading them effectively.


Breakout Direction

Determining the breakout direction is crucial when trading wedge patterns. Here are some considerations:

A) Bullish Breakout

A bullish breakout occurs when the price breaks above the upper trendline of a falling wedge or the resistance trendline of a rising wedge. Traders interpret this as a sign that buyers are gaining control, and a potential uptrend is underway.

B) Bearish Breakout

Conversely, a bearish breakout happens when the price breaches the lower trendline of a rising wedge or the support trendline of a falling wedge. This suggests that sellers are taking control, and a potential downtrend may follow.

Confirmation Indicators

To enhance the accuracy of your breakout prediction, consider using confirmation indicators such as:

  • Momentum Indicators: Like the Relative Strength Index (RSI) or the Moving Average Convergence Divergence (MACD), these can help confirm the strength of the breakout.
  • Volume: An increase in trading volume during the breakout can validate its authenticity.
  • News and Events: Keep an eye on relevant news or events that might impact the asset you're trading.

 Wedge pattern Trading Strategies

Trading wedge patterns effectively requires a well-defined strategy. Here's a step-by-step approach:


A) Entry Points

Wait for a breakout confirmation: Avoid premature entries by waiting for the price to decisively break above or below the trendlines.

  • Set entry orders: Use limit orders to enter the market at a predetermined price level after a confirmed breakout.
  • Implement stop-loss orders: Protect your capital by placing stop-loss orders just below the breakout point for bullish trades and above the breakout point for bearish trades.
  • Consider using trailing stop-loss: As the price continues to move in your favor, adjust your stop-loss to lock in profits while minimizing losses.

B) Take-Profit Levels

  • Calculate price targets: Measure the distance between the widest points of the wedge pattern (the "width").
  • Apply the width to the breakout point: For bullish breakouts, add the width to the breakout point to estimate the potential upside target. For bearish breakouts, subtract it from the breakout point for the potential downside target.
  • Take partial profits: Consider scaling out of your position as the price approaches the target to secure some gains while allowing the remainder to run.

C)  Risk Management

  • Effective risk management is crucial when trading wedge patterns:
  • Determine your position size based on your risk tolerance and the distance to your stop-loss.
  • Never risk more than you can afford to lose on a single trade.
  • Diversify your trading portfolio to spread risk across different assets and strategies.

False Breakouts

False breakouts are common in trading, and wedge patterns are no exception. Recognizing and managing false breakouts is essential to avoid losses.


Identifying False Breakouts

A) Lack of Confirmation

One sign of a potential false breakout is a lack of confirmation from volume or other indicators. If the price breaks out, but trading volume remains low, it may not be a reliable breakout.

B) Whipsaw Price Action

Whipsaw price action refers to rapid, volatile movements immediately following a breakout. This can be a sign that the breakout lacks conviction.

C) Fakeout Breakouts

Fakeout breakouts occur when the price briefly moves beyond the trendlines but quickly reverses and returns within the wedge pattern.


Dealing with False Breakouts

A) Wait for Confirmation

To reduce the risk of trading false breakouts, wait for confirmation from multiple indicators, such as volume and momentum.

B) Use Stop-Loss Orders

Always use stop-loss orders to limit potential losses in case of a false breakout. Place these orders just beyond the trendlines to minimize the impact of whipsaw price action.

C) Be Patient

Exercise patience and avoid rushing into trades. A failed breakout may provide another opportunity to enter the market at a more favorable price.


Measuring Price Targets

Measuring price targets is a critical aspect of trading wedge patterns, as it helps determine the potential profit of a trade.


Using the Width of the Wedge Pattern

To estimate price targets, traders often use the width of the wedge pattern. Here's how:

  • Measure the widest part of the wedge pattern, which is the distance between the two trendlines at their farthest point.
  • Apply this width to the breakout point in the direction of the breakout.

A) Bullish Breakout

For a bullish breakout, add the width to the breakout point. This gives you an estimate of the potential upside target.

B) Bearish Breakout

For a bearish breakout, subtract the width from the breakout point. This provides an estimate of the potential downside target.

C) Alternative Methods

While using the width of the wedge pattern is a common method, some traders prefer alternative approaches, such as Fibonacci retracement levels, to determine price targets.


Trading Psychology

Successful trading isn't just about technical analysis; it also involves managing your emotions and psychology.

Emotions in Trading

Trading can evoke powerful emotions, including fear and greed. These emotions can lead to impulsive decisions, which can be detrimental to your trading account.

A) Fear

Fear can cause traders to second-guess their strategies, exit profitable trades prematurely, or avoid trading opportunities altogether due to a fear of losses.

B)  Greed

Greed can lead to overtrading, taking excessive risks, or not sticking to a trading plan. Traders driven by greed may chase profits and ignore risk management.


Sticking to a Trading Plan

One of the most effective ways to manage emotions in trading is to have a well-defined trading plan and stick to it:

  • Set clear entry and exit criteria.
  • Establish risk-reward ratios for each trade.
  • Implement stop-loss and take-profit orders as planned.
  • Avoid impulsive decisions based on emotions.


Back testing and Analysis

To become a proficient trader of wedge patterns, it's essential to analyze historical data and backtest your strategies.

1) Historical Analysis

Examine historical price charts to identify wedge patterns and their outcomes. This helps you gain a deeper understanding of how these patterns behave in different market conditions.

2) Tweaking Strategies

Based on your historical analysis, consider tweaking your trading strategies. Adjust your entry and exit criteria, risk management rules, and other parameters to improve your trading performance.


Market Conditions

The broader market context plays a significant role when trading wedge patterns.

A) Trend Analysis

Consider the overall trend in the market. Trading in the direction of the prevailing trend can enhance the reliability of wedge pattern signals.

B)  Economic Events and News

Pay attention to economic events and news releases that can impact the asset you're trading. Sudden market-moving events can influence the breakout direction and pattern reliability.


Continuous Learning

The world of trading is ever-evolving. To stay ahead, make continuous learning a part of your trading routine.

A) Stay Informed

Stay updated with the latest developments in the financial markets, trading strategies, and technical analysis tools.

B) Practice and Adapt

Regularly practice your trading strategies and be willing to adapt to changing market conditions. What works in one market environment may not work in another.


Final Thought

Wedge chart pattern is a valuable tool in a trader's arsenal for analyzing potential trend reversals or continuations. By understanding the types of wedge patterns, their formation criteria, and effective trading strategies, you can improve your ability to make informed trading decisions. Remember to employ risk management techniques, be mindful of false breakouts, and manage your emotions while continuously learning and adapting to the ever-changing world of trading. With dedication and practice, you can harness the power of wedge patterns to enhance your trading success.

Read More
// //

A Comprehensive Review of eToro UK: World of Crypto Trading

 Unlocking the World of Crypto Trading: A Comprehensive Review of eToro UK


Cryptocurrency trading has taken the financial world by storm in recent years. As the digital assets continue to gain popularity and acceptance, individuals and investors are eager to capitalize on this booming market. eToro UK has emerged as a prominent player in the field, offering a user-friendly platform for trading cryptocurrencies and other assets. In this comprehensive review, we will delve deep into the world of eToro UK, exploring its features, regulations, fees, and more. Whether you're a seasoned trader or a novice looking to dip your toes into the cryptocurrency waters, this article aims to provide you with the insights you need to make informed decisions.


The Rise of Cryptocurrency Trading

The world of finance has witnessed a seismic shift with the advent of cryptocurrencies. These digital assets, powered by blockchain technology, have gained widespread recognition and are now considered viable investment options. Unlike traditional financial markets, cryptocurrencies operate 24/7, offering traders the opportunity to engage in trading activities at any time.


eToro UK: A Trusted Platform

Among the plethora of cryptocurrency trading platforms available today, eToro UK stands out as a reliable and user-friendly choice. This review will provide an in-depth analysis of eToro UK, shedding light on its history, features, regulatory status, fees, and more. Whether you're a seasoned trader or a novice exploring the world of crypto, eToro UK may hold the key to your financial success.


2. eToro UK Overview

History and Background

eToro was founded in 2007, making it one of the pioneering platforms in the realm of online trading. Since then, it has expanded its offerings to include cryptocurrencies, stocks, commodities, and more. eToro UK is a subsidiary of eToro Group Limited, catering specifically to the needs of traders in the United Kingdom.

Key Features

One of the standout features of eToro UK is its user-friendly interface. The platform is designed to be accessible to traders of all levels, from beginners to experts. It offers a range of tools and features that simplify the trading process, including a social trading network where users can interact, share insights, and even copy the trades of successful investors.

User-Friendly Interface

Navigating the eToro UK platform is a breeze. The intuitive design ensures that even those new to cryptocurrency trading can quickly grasp the basics. The platform provides a seamless experience for buying, selling, and managing assets, all within a few clicks.

Supported Assets

eToro UK offers a diverse selection of assets for trading. While cryptocurrencies are a major focus, the platform also allows users to trade stocks, commodities, indices, and more. This broad range of offerings provides traders with ample opportunities to diversify their portfolios and explore different investment avenues.


3. Regulation and Safety

Is eToro UK Regulated?

Regulation is a crucial aspect to consider when choosing a cryptocurrency trading platform. It ensures that the platform adheres to stringent financial standards and offers a level of protection for users. In the case of eToro UK, the platform is regulated by the Financial Conduct Authority (FCA), a reputable regulatory body in the United Kingdom. This regulatory oversight provides users with confidence in the platform's legitimacy and commitment to compliance.

Safety Measures

eToro UK takes the security of its users' accounts and funds seriously. The platform employs industry-standard security measures, including encryption technology, to safeguard sensitive information. Additionally, two-factor authentication (2FA) is available to add an extra layer of protection to user accounts.

Customer Funds Protection

To further enhance user trust, eToro UK keeps customer funds segregated from its operational funds. This means that even in the unlikely event of financial difficulties faced by the platform, user funds remain secure and unaffected.


4. eToro UK vs. Competitors

Coinbase vs. eToro UK: Which Is Better?

Choosing between eToro UK and Coinbase can be a challenging decision, as both platforms have their own unique strengths and weaknesses. In this section, we'll compare the two platforms in terms of fees, supported assets, ease of use, and other important factors to help you make an informed choice.

Trading 212 vs. eToro UK: A Comparative Analysis

Another popular platform in the UK for trading cryptocurrencies and other assets is Trading 212. We'll conduct a thorough comparison of eToro UK and Trading 212, evaluating aspects such as fees, account types, and available assets, to assist you in selecting the platform that aligns with your trading goals.


5. Trading on eToro UK

Account Types

eToro UK offers several account types to cater to the diverse needs of its users. These account types include standard accounts, Islamic accounts (suitable for traders adhering to Sharia law), and professional accounts for experienced traders.

Minimum Deposit and Minimum Withdrawal

To get started on eToro UK, you'll need to make an initial deposit. We'll explore the minimum deposit requirements and discuss the minimum withdrawal amounts, providing insights into the financial commitment required to start trading on the platform.

Leverage and Margin Trading

eToro UK offers leverage options for traders looking to amplify their positions. However, it's important to understand the risks associated with leverage and margin trading. We'll delve into the details of how leverage works on the platform and highlight its potential benefits and pitfalls.

Spread Fees

Spread fees are a common cost associated with trading on eToro UK. Understanding how these fees work and their impact on your trading activities is essential for effective financial planning. We'll break down the concept of spread fees and discuss how they can affect your overall trading experience.


6. Cryptocurrency Selection

Popular Cryptocurrencies on eToro UK

eToro UK provides access to a wide range of cryptocurrencies. From Bitcoin and Ethereum to lesser-known altcoins, the platform offers opportunities to trade various digital assets. We'll compile a list of the most popular cryptocurrencies available on eToro UK and discuss their unique characteristics.


How to Buy and Sell Cryptocurrencies

For beginners, the process of buying and selling cryptocurrencies may seem daunting. We'll provide a step-by-step guide on how to execute cryptocurrency trades on eToro UK, ensuring that you have a clear understanding of the process.


CopyTrading: A Unique Feature

One of eToro UK's standout features is CopyTrading, which allows users to replicate the trades of experienced investors. We'll delve into the mechanics of CopyTrading, explaining how it works and its potential advantages for both novice and seasoned traders.


7. Why Can't I Short Crypto on eToro UK?

Understanding Short Selling

Short selling is a trading strategy that involves profiting from the decline in the price of an asset. However, not all platforms allow users to engage in short selling of cryptocurrencies. We'll explore the concept of short selling and the reasons why it may not be available on eToro UK.

Restrictions on Short Selling

eToro UK has certain limitations when it comes to short selling crypto assets. We'll outline these restrictions and provide insights into alternative strategies that traders can employ to profit from falling cryptocurrency prices on the platform.


8. eToro UK Mobile App

Trading on the Go

In today's fast-paced world, the ability to trade on the go is a significant advantage. eToro UK offers a mobile app that allows users to access their accounts and execute trades from their smartphones and tablets. We'll review the eToro UK mobile app, highlighting its features and functionality.

App Features

The eToro UK mobile app is equipped with a range of features to enhance the trading experience. From real-time market data to intuitive order placement, we'll explore the key functionalities of the app and how they can benefit users.


9. Customer Support: How to Reach eToro UK Support 

Contacting eToro UK Support

eToro UK offers several channels through which users can contact their customer support team. Here are the primary methods:

  • Email Support: Users can reach out to eToro UK by sending an email to the provided support email address. This method is suitable for non-urgent inquiries and typically receives a response within a reasonable timeframe.
  • Live Chat: Live chat support is available on the eToro UK website and platform. It allows users to chat in real-time with a customer support representative. This option is valuable for quick questions or issues that require immediate attention.
  • Phone Support: eToro UK provides a phone number for users to call and speak directly with a customer support agent. This can be especially helpful for complex issues or situations where verbal communication is preferred.

User Experiences with eToro UK Customer Support

User experiences with customer support can provide valuable insights into the quality of service offered by a trading platform. To gain a better understanding of eToro UK's customer support, let's explore some common user experiences:

Positive Experiences:

  • Responsive Live Chat: Many users report positive experiences with eToro UK's live chat support. They appreciate the quick response times and the ability to have real-time conversations with support agents.
  • Helpful and Knowledgeable Agents: Some users have praised the competence of eToro UK's support agents, noting that they were able to resolve complex issues and provide clear explanations.

Negative Experiences:

  • Slow Email Responses: While eToro UK's email support is available, some users have reported slow response times to email inquiries. This can be frustrating, especially when users require urgent assistance.
  • Limited Weekend Support: Users who encounter issues over the weekend have noted that eToro UK's support may be less accessible during non-business hours. This limitation can be challenging for those who trade actively on weekends.
  • Mixed Phone Support Experiences: Phone support experiences with eToro UK appear to be mixed. While some users have found it helpful, others have reported difficulties in reaching a support agent or encountering long wait times.


Pros and Cons of eToro UK: A Detailed Analysis for Informed Traders

Pros and Cons of eToro UK


Pros of eToro UK:

  • User-Friendly Interface: eToro UK is known for its intuitive and user-friendly interface. Whether you're a seasoned trader or a novice, the platform's design simplifies the trading process, making it accessible to all.
  • Regulated and Trusted: eToro UK is regulated by the Financial Conduct Authority (FCA), providing users with a sense of security and trust. Regulatory oversight ensures that the platform adheres to strict financial standards.
  • Diverse Asset Selection: eToro UK offers a wide range of assets beyond cryptocurrencies, including stocks, commodities, indices, and more. This diversity allows traders to diversify their portfolios and explore various investment opportunities.
  • CopyTrading: One of eToro's unique features is CopyTrading. Users can copy the trades of experienced investors, making it easier for beginners to get started and learn from successful traders.
  • Social Trading Network: eToro includes a social trading network where users can interact, share insights, and discuss trading strategies with fellow traders. This community aspect enhances the learning experience and fosters a sense of community among users.
  • Mobile App: The eToro UK mobile app enables traders to stay connected and trade on the go. It offers real-time market data, order placement, and other essential features for mobile traders.
  • Security Measures: eToro UK takes security seriously, implementing encryption technology and offering two-factor authentication (2FA) to protect user accounts. Additionally, customer funds are segregated from operational funds, enhancing safety.

  • Educational Resources: The platform provides educational resources, including webinars, articles, and video tutorials, to help users improve their trading knowledge and skills.
  • Demo Account: eToro UK offers a demo account, allowing users to practice trading with virtual funds before committing real capital. This feature is particularly valuable for newcomers to gain confidence and experience.
  • Leverage Options: For experienced traders, eToro UK offers leverage options, allowing for amplified positions. However, it's crucial to use leverage with caution due to the associated risks.


Cons of eToro UK:

  • Limited Cryptocurrency Selection: While eToro UK does offer a variety of cryptocurrencies, the selection may be more limited compared to some other platforms. Users looking for access to a broader range of altcoins may need to explore alternative exchanges.
  • Spread Fees: eToro UK charges spread fees, which can impact the cost of trading. These fees can add up, especially for frequent traders, and should be considered in your trading strategy.
  • Restrictions on Short Selling: eToro UK has restrictions on short selling cryptocurrency assets. If you're interested in shorting cryptocurrencies, this platform may not provide the flexibility you need.
  • Limited Research Tools: While eToro offers basic research tools, it may not be as comprehensive as some dedicated research platforms. Traders who rely heavily on in-depth analysis may find the platform lacking in this regard.
  • Minimum Deposit: eToro UK has a minimum deposit requirement, which varies based on the account type. For some traders, the initial deposit may be higher than what they are comfortable with.
  • Withdrawal Fees: While eToro UK allows for withdrawals, there may be withdrawal fees associated with certain transactions. It's essential to review these fees before initiating a withdrawal.
  • Limited Customer Support Options: Some users have reported that eToro's customer support can be slow in responding to inquiries. This can be frustrating, especially during times of high market volatility when timely assistance is crucial.
  • Limited Account Types: While eToro UK offers different account types, some traders may find the options limited, particularly if they are seeking advanced features or benefits.


eToro UK offers a user-friendly platform with unique features like CopyTrading and a social trading network. Its regulatory compliance and security measures add to its credibility. However, users should be aware of the platform's limitations, including the restricted cryptocurrency selection, spread fees, and withdrawal fees. It's essential to carefully consider your trading goals and preferences when deciding whether eToro UK is the right platform for you.


Visit ETORO.com


Final Thoughts

In the ever-evolving world of cryptocurrency trading, eToro UK has established itself as a reputable and user-friendly platform. Whether you're a seasoned trader or a newcomer to the crypto scene, eToro UK offers a range of features and opportunities to help you achieve your financial goals. We hope this comprehensive review has provided you with the information you need to make an informed decision about whether eToro UK is the right platform for your trading endeavors.


Read More

Trending