Showing posts with label Trading Strategies. Show all posts
// // Leave a Comment

Intraday Trading: Top 50 Tips for Success

Mastering Intraday Trading: Top 50 Tips for Success

Intraday Trading: Top 50 Tips for Success


Intraday trading, also known as day trading, is a thrilling and dynamic way to participate in the financial markets. Unlike traditional investing, where positions are held for days, weeks, or even years, intraday trading involves buying and selling securities within the same trading day. While it offers the potential for high returns, it also carries significant risks. To help you navigate this exciting but challenging endeavor, we've compiled the top 50 intraday trading tips to enhance your chances of success.

1. Understand Market Basics:

Before diving into intraday trading, grasp the fundamentals of how the stock market operates, including concepts like supply and demand, market trends, and trading volumes.

2. Choose the Right Broker:

Select a reputable broker with low commissions, fast order execution, and reliable trading platforms suited for intraday trading.

3. Develop a Trading Plan:

Create a well-defined trading plan outlining your goals, risk tolerance, entry and exit strategies, and money management rules.

4. Start Small:

Begin with a small trading capital to minimize risk while you hone your skills and gain experience.

5. Focus on Liquidity:

Trade highly liquid stocks or instruments to ensure easy entry and exit from positions without significant price slippage.

6. Set Realistic Goals:

Set achievable daily or weekly profit targets and avoid chasing unrealistic returns, which could lead to impulsive decisions.

7. Master Technical Analysis:

Learn to interpret price charts, patterns, and indicators to identify potential entry and exit points accurately.

8. Follow Market Trends:

Trade in the direction of the prevailing market trend to increase the probability of successful trades.

9. Control Emotions:

Keep emotions like fear and greed in check by sticking to your trading plan and avoiding impulsive decisions.

10. Practice Discipline:

Adhere to strict discipline regarding trade execution, risk management, and following your predetermined strategies.

11. Use Stop Loss Orders:

Implement stop-loss orders to limit losses and protect your capital from significant downturns in the market.

12. Embrace Volatility:

Volatility creates opportunities for intraday traders, but it also increases risk. Learn to navigate volatility effectively.

13. Stay Informed:

Stay updated with financial news, market developments, and economic indicators that may impact your trading decisions.

14. Avoid Overtrading:

Resist the temptation to overtrade by focusing on quality setups rather than the quantity of trades.

15. Diversify Your Portfolio:

Spread your risk by trading a diverse range of instruments across different sectors and industries.

16. Keep Learning:

Stay curious and continuously educate yourself about new trading strategies, tools, and techniques.

17. Backtest Your Strategies:

Before implementing a new strategy, backtest it thoroughly on historical data to assess its viability and performance.

18. Manage Risk Effectively:

Allocate only a small portion of your trading capital to each trade and ensure your risk-reward ratio is favorable.

19. Avoid Herd Mentality:

Don't blindly follow the crowd. Conduct your analysis and make independent trading decisions.

20. Adapt to Changing Market Conditions:

Be flexible and adapt your trading strategies to different market environments, whether bullish, bearish, or sideways.

21. Use Leverage Wisely:

Exercise caution when trading on margin and understand the risks associated with leverage.

22. Keep a Trading Journal:

Maintain a detailed trading journal to track your performance, analyze mistakes, and identify areas for improvement.

23. Practice Patience:

Be patient and wait for high-probability setups to materialize before entering trades.

24. Avoid Holding Overnight Positions:

Minimize overnight risk by closing all positions before the end of the trading day.

25. Pay Attention to Trading Psychology:

Develop a strong mindset and cultivate traits like patience, discipline, and resilience to succeed in intraday trading.

26. Learn from Mistakes:

View losses as learning opportunities and analyze your mistakes to prevent them from recurring.

27. Test Different Timeframes:

Experiment with various timeframes, such as 5-minute, 15-minute, or hourly charts, to find what works best for your trading style.

28. Consider Seasonal Trends:

Be aware of seasonal patterns and trends that may influence certain stocks or sectors.

29. Monitor Volume:

Pay attention to trading volume, as significant volume spikes often precede price movements.

30. Utilize Limit Orders:

Use limit orders to enter and exit trades at specific price levels, reducing the risk of slippage.

31. Trade During High-Volume Hours:

Focus your trading activity during peak market hours when liquidity and volatility are highest.

32. Stay Balanced:

Maintain a balance between trading and personal life to prevent burnout and maintain mental clarity.

33. Be Aware of News Events:

Stay vigilant about upcoming news events and earnings announcements that could impact the market.

34. Develop a Routine:

Establish a daily routine that includes pre-market preparation, trading hours, and post-market analysis.

35. Network with Other Traders:

Connect with fellow traders to share insights, strategies, and experiences, fostering a supportive trading community.

36. Stay Organized:

Keep your trading workspace clutter-free and organized to minimize distractions and optimize focus.

37. Focus on Quality Execution:

Prioritize quality trade execution over speed, ensuring accuracy and precision in your orders.

38. Manage Expectations:

Understand that losses are inevitable in trading and focus on long-term consistency rather than short-term gains.

39. Stay Humble:

Remain humble and open-minded, recognizing that even experienced traders have room for improvement.

40. Take Breaks:

Take regular breaks during trading sessions to recharge and maintain mental sharpness.

41. Utilize Technology:

Take advantage of trading tools and software that can automate tasks, provide real-time data, and streamline your workflow.

42. Stay Healthy:

Prioritize physical and mental well-being through exercise, proper nutrition, and stress management techniques.

43. Review Your Trades:

Regularly review your past trades to identify patterns, strengths, and areas for improvement.

44. Stay Committed:

Stay committed to your trading journey, understanding that success takes time, effort, and persistence.

45. Be Adaptable:

Remain flexible and open to adjusting your strategies based on market feedback and evolving conditions.

46. Cultivate Positivity:

Maintain a positive outlook and focus on continuous growth and improvement in your trading skills.

47. Seek Mentorship:

Consider seeking guidance from experienced traders or mentors who can provide valuable insights and advice.

48. Stay Legal and Ethical:

Adhere to all regulatory requirements and ethical standards in your trading activities.

49. Celebrate Milestones:

Acknowledge and celebrate your trading milestones, whether it's hitting a profit target or achieving a personal best.

50. Enjoy the Journey:

Above all, enjoy the journey of intraday trading, embracing both the challenges and triumphs along the way.


FAQ : Intraday Trading 


Q: How much capital do I need to start intraday trading?

A: The amount of capital needed for intraday trading varies depending on factors such as your trading strategy, risk tolerance, and the markets you trade. It's advisable to start with a capital you can afford to lose and gradually increase it as you gain experience and confidence.

Q: What are the risks involved in intraday trading?

A: Intraday trading carries various risks, including market volatility, price slippage, and emotional bias. Traders may also face the risk of losing their entire investment if they fail to manage risk effectively or make poor trading decisions.

Q: How can I manage risk in intraday trading?

A: Risk management is crucial in intraday trading. Traders can manage risk by using stop-loss orders to limit losses, diversifying their trading portfolio, and allocating only a small portion of their capital to each trade. It's also essential to avoid overleveraging and to adhere to a well-defined trading plan.

Q: Are there any specific trading strategies for intraday trading?

A: There are numerous trading strategies suited for intraday trading, including trend following, range trading, breakout trading, and scalping. The choice of strategy depends on factors such as market conditions, trading style, and risk tolerance. It's essential to backtest and refine your chosen strategy before implementing it in live trading.


Read More
// // Leave a Comment

Quotex Review 2024 | Must Read Before Joining | Avoid Getting Scammed & Learn the Right Way to Profit

Unlocking Quotex: Your Guide to Binary Trading Success and Scam Prevention


In the dynamic realm of online trading, Quotex shines as a leading platform for binary trading enthusiasts. However, amidst its potential for profit, one must be vigilant against lurking risks, especially concerning scams. Let's explore what Quotex offers, its legality, potential earnings, and how to navigate the binary trading world responsibly.


What is Quotex?

Quotex is a robust online trading platform that specializes in binary options trading. It empowers users to speculate on the direction of various financial assets, including currencies, commodities, stocks, and indices, within predetermined time frames. Traders predict whether an asset's price will rise or fall, earning a predefined payout upon correct prediction.


Legality of Quotex and Countries Allowing It

Quotex operates in numerous countries, but its legality varies across jurisdictions. Traders must diligently verify the legality of binary options trading in their respective regions before engaging with Quotex or similar platforms.


Can You Make Money with Quotex?

Indeed, making money with Quotex is feasible, albeit not without risks. Binary options trading presents opportunities for profit, contingent upon knowledge, strategy, and prudent risk management. It's imperative to recognize that trading involves inherent risks, and profitability is not guaranteed.


Unveiling Quotex Secret Strategies: Myth vs. Reality

YouTube hosts a plethora of videos promising Quotex secret strategies capable of turning modest investments into substantial profits, exemplified by "Secret Strategy 1 to $100,000." While some strategies may yield short-term gains, many are misleading or outright fraudulent. Beware of YouTubers enticing viewers with promises of quick riches through affiliate links or paid courses, often prioritizing referrals over genuine trading success.


The Real Way to Make Money with Quotex

Achieving sustainable profits with Quotex necessitates a disciplined approach and continuous learning:


  • Start with a Demo Account: Begin trading with a $100 demo account to acquaint yourself with the platform and trading concepts without risking real funds.
  • Treat Demo Account Seriously: Approach your demo account as if it were real money to hone trading psychology and emotional control.
  • Develop and Test Strategies: Experiment with diverse trading strategies, identifying those aligning with your trading style and risk tolerance. Refine chosen strategies through practice.
Check Some Poplar article on  Trading Strategies
  • Implement Money Management: Exercise prudent capital management by determining trade risk and adhering to strict risk management principles to safeguard capital.
  • Experience and Learning: Cultivate trading proficiency through continuous learning and experience accumulation. Understand that trading proficiency evolves over time with practice and ongoing education.


Essential Points for Aspiring Traders

Before immersing yourself in Quotex or any trading endeavor, consider these crucial points:
  • Learn the Basics: Gain a solid grasp of trading fundamentals before risking real capital.
  • Practice on Demo Accounts: Refrain from trading with real funds until proficiently practicing on demo accounts.
  • Prioritize Money Management: Employ effective money management strategies to mitigate excessive losses.
  • Embrace Learning and Experience: Acknowledge that trading success entails continuous learning, adaptation, and experience accumulation.

  • Start with Low Funds: Begin with as little as $10 and gradually increase your investment as you gain experience and confidence. Learning to grow your $10 in a real account allows you to learn and earn simultaneously while only risking a small amount.
  • Withdraw Funds to Confirm Legitimacy: Withdraw a small portion of your profits to confirm if the platform processes withdrawals efficiently. This step helps verify the platform's credibility and ensures you're trading with a reliable service.


How to Open a Quotex Account

Opening a Quotex account is a seamless process:

  • Visit the Quotex Website: Navigate to the official Quotex website to initiate the signup process.
  • Register: Click on "Sign Up" or "Register" and provide requisite information, including email, password, and preferred currency.
  • Verify Your Account: Follow instructions to verify your email and complete registration.
  • Deposit Funds: Upon registration, deposit funds into your account via various convenient methods.
  • Start Trading: With funds deposited, embark on your binary options trading journey on Quotex's intuitive platform.

Open a Quotex account and apply the promo code now!

As a new user, leverage a special offer by applying a promo code during the deposit process to receive a 50% bonus. Apply promo code by registering through this Promocode to augment your trading capital and seize additional profit opportunities. Its applicable only when you deposit 50$, you can get 50% deposit bonus anytime, I will recommed you to learn trading and binary option through demo account because if you join through my Quotex Referal codeQuotex Referal code then i will get affilate earning only when you make profit so learn first make profit and be happy. remember never risk big amount always stick to 1$ trade till you reach 80% accuracy for month


Deposit and Withdrawal Methods

Quotex offers diverse deposit and withdrawal methods, catering to traders worldwide:

  • Deposit Methods: Credit/debit cards, bank transfers, e-wallets (e.g., Skrill, Neteller), and cryptocurrency (Bitcoin, Ethereum).
  • Withdrawal Methods: Withdraw funds conveniently via bank transfer, e-wallets, or cryptocurrency, based on your preference and region.


Why Choose Quotex Binary Options Platform?

Quotex distinguishes itself among binary options platforms for several compelling reasons:


User-Friendly Interface: Designed for simplicity and accessibility, catering to both novice and experienced traders.

Wide Range of Assets: Trade across diverse assets, including currencies, commodities, stocks, and indices, facilitating exploration of various market opportunities.

Instant Execution: Benefit from swift and reliable order execution, ensuring timely entry and exit from trades sans delays or slippage.

Advanced Charting Tools: Access robust charting tools and technical indicators for in-depth analysis and informed trading decisions.

Secure and Regulated: Prioritizes user security and privacy, employing robust encryption and adhering to regulatory standards in operating jurisdictions.

Responsive Customer Support: Enjoy dedicated customer support services to address queries or issues encountered while trading.

Read More
// // Leave a Comment

Why IQ Option Signals Are a Waste of Time: Must Read to Protect Your Capital

 Why IQ Option Signals Are a Waste of Time

Why IQ Option Signals Are a Waste of Time


IQ Option is a well-known trading platform that offers a variety of assets for traders, including binary options, Forex, and cryptocurrencies. Among the features offered by IQ Option are trading signals, which are intended to help traders make informed decisions. However, many traders find these signals to be less useful than expected. In this article, we will explore why IQ Option signals are often a waste of time. We'll delve into their inefficacy, potential pitfalls, and what traders should consider instead.


Understanding IQ Option Signals

Trading signals are essentially alerts or suggestions for entering trades on specific assets at certain times. These signals are typically based on technical analysis, algorithmic predictions, or market trends. IQ Option signals are designed to help traders identify profitable trading opportunities without needing to perform their own analysis.


1. Lack of Accuracy

One of the primary issues with IQ Option signals is their lack of accuracy. Trading signals are only as good as the algorithms or analysts behind them. Many users report that these signals often fail to predict market movements accurately. Markets are influenced by a myriad of factors, including economic data, geopolitical events, and market sentiment, which are difficult to forecast with precision.


Key Points:

  • Signals often fail to account for all market variables.
  • Over-reliance on algorithms can lead to inaccurate predictions.


2. Market Volatility

Financial markets are inherently volatile, and prices can change rapidly. Signals provided by IQ Option might be outdated by the time you act on them. The delay between signal generation and trade execution can result in missed opportunities or losses.


Key Points:


  • Rapid market changes can render signals obsolete.
  • Time-sensitive nature of trading signals can lead to poor execution.


3. Over-Simplification

IQ Option signals tend to oversimplify the trading process. While signals might indicate a favorable entry or exit point, they don't provide the full context behind the recommendation. Successful trading requires a comprehensive understanding of market conditions, risk management, and strategy. Relying solely on signals can lead to a lack of deeper market insight.


Key Points:


  • Signals offer limited information and context.
  • Effective trading requires a holistic approach beyond simple signals.


4. Psychological Impact

Trading based on signals can have a negative psychological impact. Traders might become overly reliant on these signals, leading to a lack of confidence in their own analysis and decision-making skills. Additionally, experiencing repeated losses from following inaccurate signals can result in frustration and decreased motivation.


Key Points:


  • Over-reliance on signals can erode trader confidence.
  • Frequent losses from poor signals can affect trader psychology.


5. Potential for Scams

The trading signal industry is rife with scams and unverified services. While IQ Option is a reputable platform, it's important to remain cautious about the origin of the signals. Some signal providers might not have your best interests at heart and could be motivated by their own financial gain.


Key Points:


  • Be wary of unverified and potentially fraudulent signal providers.
  • Always verify the credibility of the signal source.


6. Lack of Personalization

Trading signals are generally broad recommendations and do not take individual trader preferences, risk tolerance, or trading strategies into account. What might be a good trade for one person could be disastrous for another. Personalizing your trades based on your own analysis is often more effective.


Key Points:


  • Signals do not cater to individual trader needs.
  • Personalized trading strategies often yield better results.


7. Dependency Issues

Using trading signals can create dependency issues where traders rely too heavily on external advice rather than developing their own trading skills. This can hinder the growth and development of a trader, making them less competent and self-sufficient over time.


Key Points:


  • Over-dependency on signals can stifle personal trading growth.
  • Developing personal trading skills is crucial for long-term success.


8. Missed Learning Opportunities

Trading is a skill that improves with experience and learning. Relying on signals can deprive traders of valuable learning opportunities. By performing your own analysis, you gain insights into market dynamics, improve your technical analysis skills, and develop a deeper understanding of trading strategies.


Key Points:


  • Relying on signals limits learning and growth opportunities.
  • Independent analysis fosters better market understanding and skills development.


9. Cost Implications

Some trading signals come with a cost, whether through subscription fees or hidden charges. Considering the questionable accuracy and utility of many signals, the cost may not be justified. Investing in quality educational resources or trading tools might provide better value for money.


Key Points:

  • Subscription fees for signals can be costly.
  • Investing in educational resources can offer better returns.


10. Alternative Approaches

Instead of relying on IQ Option signals, traders should consider alternative approaches that can lead to more consistent success. These include:


  • Learning Technical Analysis: Understanding charts, indicators, and market patterns.
  • Fundamental Analysis: Analyzing economic indicators, financial statements, and news.
  • Risk Management: Developing strategies to manage risk and protect capital.
  • Developing a Trading Plan: Creating a structured approach to trading with clear goals and strategies.
Key Points:

  • Alternative approaches can provide a more reliable and comprehensive trading strategy.
  • Investing time in education and skill development pays off in the long run.


While IQ Option signals may seem like an attractive tool for easy trading success, they often fall short in practice. Issues such as lack of accuracy, market volatility, and over-simplification can lead to poor trading outcomes. Additionally, relying on signals can hinder personal growth and create dependency issues.

For those serious about trading, it's essential to invest time in learning and developing your own skills. By understanding market dynamics, performing your own analysis, and developing personalized trading strategies, you can achieve more consistent and reliable results. Remember, there's no shortcut to success in trading – diligence, education, and experience are key.

Read More
// // Leave a Comment

How to Identify Strong Trends with Confidence

Mastering Trend Lines: A Beginner's Guide to Identifying Strong Trends  


How to Identify Strong Trends with Confidence


Understanding trend lines is crucial for successful trading and investment strategies. They provide valuable insights into market sentiment and help identify potential entry and exit points. In this comprehensive guide, we will delve into the art of finding strong trend lines, empowering you to make informed decisions in the dynamic world of finance.


H1: What are Trend Lines?


Definition: Trend lines are graphical representations of the direction and strength of price movements in a financial market over a specific period. They connect consecutive lows or highs on a price chart, highlighting the prevailing trend.


Types of Trend Lines


1. Upward Trend Lines:


  • These lines are drawn by connecting consecutive higher lows and indicate an upward trend in the market.
  • They serve as support levels, suggesting buying opportunities when prices approach them.

2. Downward Trend Lines:


  • Downward trend lines connect consecutive lower highs, signaling a downtrend.
  • They act as resistance levels, indicating potential selling opportunities when prices rally towards them.

3. Sideways Trend Lines:


  • Sideways or horizontal trend lines connect similar highs or lows, reflecting a period of consolidation or indecision in the market.
  • Traders often use these lines to identify potential breakout or breakdown points.


H3: Characteristics of Strong Trend Lines


1. Steepness:

  • Strong trend lines exhibit a consistent and significant slope, indicating the strength of the prevailing trend.
  • Steeper trend lines suggest a more aggressive buying or selling pressure.

2. Validation:


  • Valid trend lines are those that are tested and confirmed by multiple touchpoints, demonstrating their reliability.
  • The more times a trend line is respected, the stronger it becomes.

3. Volume Confirmation:


  • Strong trend lines are often accompanied by significant trading volume, confirming the conviction behind the price movement.
  • Increased volume validates the strength of the trend and enhances its reliability.


H4: How to Identify Strong Trend Lines


1. Selecting the Right Timeframe:


  • Choose an appropriate timeframe based on your trading or investment horizon.
  • Short-term traders may focus on intraday or hourly charts, while long-term investors may prefer daily or weekly charts.

2. Locating Swing Highs and Lows:


  • Identify significant swing highs and lows where price reversals occur.
  • Connect these points using straight lines to establish the primary trend direction.

3. Confirming Trend Continuity:


  • Look for multiple touchpoints along the trend line to confirm its validity.
  • The more times the price respects the trend line, the stronger it becomes.

4. Analyzing Volume Patterns:


  • Observe trading volume to validate the strength of the trend.
  • Increasing volume during price advances or declines reinforces the significance of the trend line.


H5: Practical Tips for Trading with Trend Lines


1. Use Multiple Timeframes:


  • Combine trend lines from different timeframes to gain a comprehensive view of the market trend.
  • Aligning trends across various timeframes enhances the accuracy of your analysis.

2. Wait for Confirmation:


  • Exercise patience and wait for price confirmation before entering a trade based on trend lines.
  • Confirmation could include a decisive breakout or breakdown accompanied by significant volume.


3. Implement Risk Management Strategies:


  • Set stop-loss orders to limit potential losses in case the market reverses against your position.
  • Calculate risk-reward ratios to ensure favorable trade setups and protect your capital.


Mastering the art of identifying strong trend lines is essential for navigating the complexities of financial markets. By understanding their characteristics and employing effective techniques, traders and investors can gain valuable insights into market trends and make informed decisions. Remember, trend lines are not infallible indicators, but when used in conjunction with other analysis tools, they can significantly enhance your trading success. Start practicing and honing your skills in trend line analysis to unlock new opportunities in the world of trading and investing.

Read More
// // Leave a Comment

What is Demand and Supply zone and explain best trading strategy.

 Understanding Demand and Supply Zones in Technical Analysis


Understanding Demand and Supply Zones in Technical Analysis

In the world of trading and technical analysis, one of the fundamental concepts that traders often rely on is the identification of demand and supply zones. These zones play a crucial role in determining potential price movements in various financial markets. In this comprehensive guide, we will delve into the concept of demand and supply zones, explore the rules of plotting them, discuss different types of demand and supply zones, and even touch on demand zones based on time zones.

H1: What are Demand and Supply Zones?

Before we dive into the nitty-gritty details, let's start by understanding what demand and supply zones are and why they matter in technical analysis.

What Are Demand Zones?

Demand zones are price levels or areas on a chart where buying interest exceeds selling pressure, causing prices to rise or reverse direction. These zones are identified as areas where a significant number of buyers are willing to purchase an asset, often due to perceived value or other factors.

What Are Supply Zones?

Conversely, supply zones are price levels or areas where selling pressure outweighs buying interest, leading to a potential price decline or reversal. These zones represent areas where a significant number of sellers are looking to offload their assets.

In essence, demand and supply zones are key areas on a price chart that reflect imbalances in the market. Traders and analysts use these zones to make informed decisions about their trading strategies.


Price Action and Demand/Supply Zones

The concept of demand and supply zones is closely tied to price action, a fundamental aspect of technical analysis. Price action refers to the movement of an asset's price over time as depicted on a chart. It is the raw data of a market and is devoid of any indicators or oscillators.

Price action traders believe that all available information is already reflected in the asset's price, making it the most reliable source of information for making trading decisions. Demand and supply zones are identified through careful analysis of price action, allowing traders to anticipate potential reversals or continuations in price trends.


 Rules of Plotting Demand and Supply Zones

Identifying demand and supply zones requires a systematic approach and adherence to certain rules. Let's explore the essential rules for plotting these zones:

1. Identify Swing Highs and Lows

To begin, you must identify the swing highs and swing lows on the price chart. Swing highs are points where the price temporarily peaks before declining, while swing lows are points where the price bottoms out before rising.

2. Connect the Dots

Next, draw horizontal lines connecting the most recent swing highs and swing lows. These lines form the boundaries of potential demand and supply zones. A zone is created when the price approaches and touches these lines.

3. Observe Price Reactions

As the price approaches a demand or supply zone, carefully observe how it reacts. If the price reverses direction near a zone, it can be considered a strong indicator of the zone's validity.

4. Multiple Timeframe Analysis

To enhance the accuracy of your zones, consider conducting multiple timeframe analysis. This involves examining demand and supply zones on different timeframes, such as daily, hourly, and even minute charts. Zones that align across multiple timeframes are typically more reliable.


Types of Demand and Supply Zones

Demand and supply zones can be categorized into various types based on their characteristics and significance. Here are some common types:

1. Fresh Demand and Supply Zones

Fresh demand and supply zones are areas that have recently formed and have not been retested by the price. Traders often pay close attention to these zones as they are considered strong potential reversal points.

2. Tested Demand and Supply Zones

Tested zones are areas that the price has already revisited once. These zones can still be relevant, but their strength may diminish with each subsequent test.

3. Strong and Weak Zones

Zones can also be classified as strong or weak based on the number of times they have been tested. Strong zones have withstood multiple tests and are considered more reliable, while weak zones may break more easily.


Demand Zones Based on Time Zones

In addition to the conventional understanding of demand and supply zones, some traders incorporate the concept of time zones into their analysis. This approach involves identifying zones based on specific time periods, such as daily, weekly, or monthly.

#1 Daily Demand Zones

Daily demand zones are areas where the price has shown a strong tendency to reverse on a daily chart. Traders often use these zones for intraday trading strategies.

2# Weekly and Monthly Demand Zones

Weekly and monthly demand zones are areas of significant price reversal on longer timeframes. These zones are typically of greater importance to swing traders and investors.


Most Popular Demand and Supply Zones

Among the myriad of demand and supply zones that traders encounter, some stand out as particularly popular and significant. Let's explore two of the most commonly used ones:

1. Support and Resistance Zones

Support zones represent areas where buying interest is expected to be strong, preventing the price from falling further. Conversely, resistance zones are areas where selling pressure is anticipated to be strong, preventing the price from rising further. These zones are essential in technical analysis and are monitored closely by traders.

2. Fibonacci Retracement Zones

Fibonacci retracement zones are levels on a price chart that are based on the Fibonacci sequence. These zones are derived by drawing horizontal lines at key Fibonacci ratios, such as 38.2%, 50%, and 61.8%. Traders often use these zones to identify potential reversal or retracement points.


Demand and supply zone trading strategy Steps 


Indicators and Tools:

  • Daily price chart 

  • Horizontal lines to mark demand and supply zones 

  • Support and resistance lines for confirmation 

  • Risk management plan (stop-loss and take-profit levels)


  • Identify Strong Demand and Supply Zones: Start by analyzing the daily price chart to identify strong demand and supply zones. Look for areas where significant reversals have occurred in the past, especially those with multiple touches.
  • Mark Zones: Draw horizontal lines to mark these zones on your chart. These lines should encompass the price action within the zone.
  • Confirmation: Use support and resistance levels or other technical indicators to confirm the strength of the identified zones. The more confluence you have, the stronger the zone.
  • Entry Point: When the price approaches a demand zone, consider a long (buy) entry, expecting a reversal or bounce. Conversely, when the price nears a supply zone, consider a short (sell) entry, anticipating a reversal or pullback.
  • Risk Management: Implement strict risk management by setting a stop-loss order just below the demand zone for long trades and above the supply zone for short trades. Calculate your position size based on your risk tolerance and the distance to your stop-loss.
  • Take Profit: Determine your take-profit level based on your risk-reward ratio. It's common to set it at a 2:1 or 3:1 ratio, meaning your potential profit should be at least twice or three times your risk.
  • Trail Stops: For more extended trends, consider trailing your stop-loss to lock in profits as the price moves in your favor.
  • Monitor Trade: Keep a close eye on your trade and adjust your stop-loss or take-profit levels as necessary. Be prepared to exit if the price action suggests a change in the trend.
  • Repeat: Continuously scan the markets for new demand and supply zones and repeat the process.


Key Tips:

  • Patience is crucial. Wait for price action to approach your zones before entering a trade.
  • Combine demand and supply zones with other technical analysis tools for added confirmation.
  • Practice proper risk management to protect your capital.

Remember that no trading strategy is foolproof, and there are risks involved in trading. Always use proper risk management and consider paper trading or back testing before implementing any strategy with real capital.


Final Thoughts

Demand and supply zones are fundamental concepts in technical analysis that provide traders with valuable insights into potential price movements. By understanding the rules of plotting these zones and recognizing their different types, traders can make more informed decisions and improve their overall trading strategies.


Whether you are a day trader, swing trader, or long-term investor, incorporating demand and supply zones into your analysis can be a valuable tool for navigating the complex world of financial markets. Remember that while these zones are powerful indicators, they should be used in conjunction with other forms of analysis and risk management strategies to maximize your trading success.

Read More
// // Leave a Comment

Mastering Volume Profile: A Comprehensive Guide to Profitable Trading

 Understanding Volume Profile: A Powerful Trading Strategy

Volume profile


In the world of trading, there are countless strategies and tools available to traders, each with its own unique strengths and weaknesses. One such tool that has gained popularity among traders is the Volume Profile. In this comprehensive guide, we will explore what Volume Profile is, how to use it as a trading strategy, and how to make profitable trades with it. By the end of this article, you'll have a solid understanding of Volume Profile and how to integrate it into your trading arsenal.


What is Volume Profile?

Volume Profile is a technical analysis tool used in trading to analyze the distribution of trading volume over a specified time period, typically displayed as a histogram on a price chart. It helps traders visualize where the majority of trading activity has occurred within a given range of prices. This information can be invaluable in making informed trading decisions.

How Does Volume Profile Work?

Volume Profile divides a price chart into price levels or price bins, and for each of these levels, it calculates the total volume traded at that price during the specified time period. These volume values are then plotted as bars or a histogram on the price chart. The result is a graphical representation of the volume distribution across different price levels.

Volume Profile Components

Key Components

  • Point of Control (POC): The price level with the highest traded volume within the specified period is called the Point of Control. It often represents a significant level of interest for traders.
  • Value Area: The Value Area encompasses the price levels where the majority of trading activity occurred, typically covering around 70% of the total volume. It consists of the upper and lower value areas.
  • Volume Nodes: These are price levels where significant volume has traded, but they may not necessarily fall within the Value Area. Volume Nodes can act as support or resistance levels.


Visual Representation : Volume Profile Chart


Benefits of Using Volume Profile

Before delving into how to use Volume Profile as a trading strategy, it's essential to understand its advantages:

  • Enhanced Decision-Making: Volume Profile provides a clear visual representation of support and resistance levels based on trading activity, helping traders make informed decisions.
  • Customizable Timeframes: Traders can adapt Volume Profile to different timeframes, making it suitable for various trading styles, from day trading to long-term investing.
  • Objective Analysis: Unlike some subjective technical analysis tools, Volume Profile relies on objective data, making it a valuable tool for traders seeking data-driven insights.


Volume Profile Trading Strategies

1. Identifying Key Levels

Volume Profile can help traders identify crucial price levels, including:

Point of Control (POC): This level often serves as a point of interest for traders, as it represents the highest traded volume and may act as support or resistance.

Value Area: The upper and lower boundaries of the Value Area can also act as support and resistance levels. Breakouts from these areas can be significant trading opportunities.


2. Volume-Based Entries

Traders can use Volume Profile to time their entries by looking for confirmation of support or resistance at key levels. For example, a trader might enter a long position if the price bounces off a Volume Node within the Value Area.


3. Volume Profile and Price Patterns

Volume Profile can be combined with traditional price patterns like head and shoulders, flags, or triangles. Traders look for these patterns within the context of Volume Profile to enhance their trading decisions.


Putting Volume Profile into Practice


Step-by-Step Guide

Now that we understand the basics of Volume Profile and its potential benefits, let's discuss how to use it effectively in your trading strategy.


1. Select a Timeframe

Start by selecting the timeframe that aligns with your trading goals. Short-term traders may use intraday charts, while long-term investors might opt for daily or weekly charts.

2. Plot the Volume Profile

Add the Volume Profile indicator to your trading platform and apply it to your selected timeframe. This will create the histogram on your price chart.

3. Identify Key Levels

Locate the Point of Control (POC) and the Value Area on your chart. These are the primary areas of interest where you'll be focusing your analysis.

4. Look for Entry Opportunities

When the price approaches the POC or significant Volume Nodes within the Value Area, look for confirmation signals such as candlestick patterns or trend indicators. This can be an excellent time to enter a trade.

5. Set Stop-Loss and Take-Profit Levels

Always use risk management tools like stop-loss orders to limit potential losses. Determine your take-profit levels based on the potential price targets identified by Volume Profile.

6. Monitor Trade Progress

Keep a close eye on your trade as it progresses. If the price reaches your take-profit level or violates your stop-loss, be prepared to exit the trade.


Common Mistakes and Tips

Common Mistakes to Avoid

  • Ignoring Risk Management: Failing to use stop-loss orders can lead to significant losses when trading with Volume Profile.
  • Overcomplicating Analysis: It's easy to become overwhelmed by excessive technical indicators. Stick to the basics and use Volume Profile as a complementary tool.
  • Neglecting Fundamental Analysis: Volume Profile is a valuable technical tool, but it should not replace fundamental analysis when making trading decisions.


Tips for Successful Volume Profile Trading

  • Practice Patience: Wait for clear confirmations at key levels before entering a trade.
  • Backtest Your Strategy: Test your Volume Profile strategy on historical data to assess its viability.
  • Continuous Learning: Stay updated with new developments in Volume Profile techniques and market conditions.


Final Thoughts

Volume Profile is a versatile and data-driven trading tool that can significantly enhance your trading strategy. By understanding its components, benefits, and how to use it effectively, you can improve your ability to identify profitable trading opportunities and manage risk. Remember that like any trading strategy, mastering Volume Profile takes time, practice, and ongoing education. With dedication and discipline, you can integrate Volume Profile into your trading toolkit and work towards achieving your trading goals.

Read More
// // Leave a Comment

Unlocking the Secrets of the Falling Wedge Pattern in Trading

Understanding the Falling Wedge Pattern in Trading

Understanding the Falling Wedge Pattern in Trading


In the world of technical analysis, the falling wedge pattern is a valuable tool that traders use to identify potential trend reversals or continuations. This comprehensive guide aims to provide traders, both novice and experienced, with an in-depth understanding of the falling wedge pattern. We'll explore its definition, various types, strategies for trading it, and key price action dynamics, including entry and exit points. Additionally, we'll discuss the best indicators to use when working with this pattern to enhance your trading success.


What is a Falling Wedge Pattern?

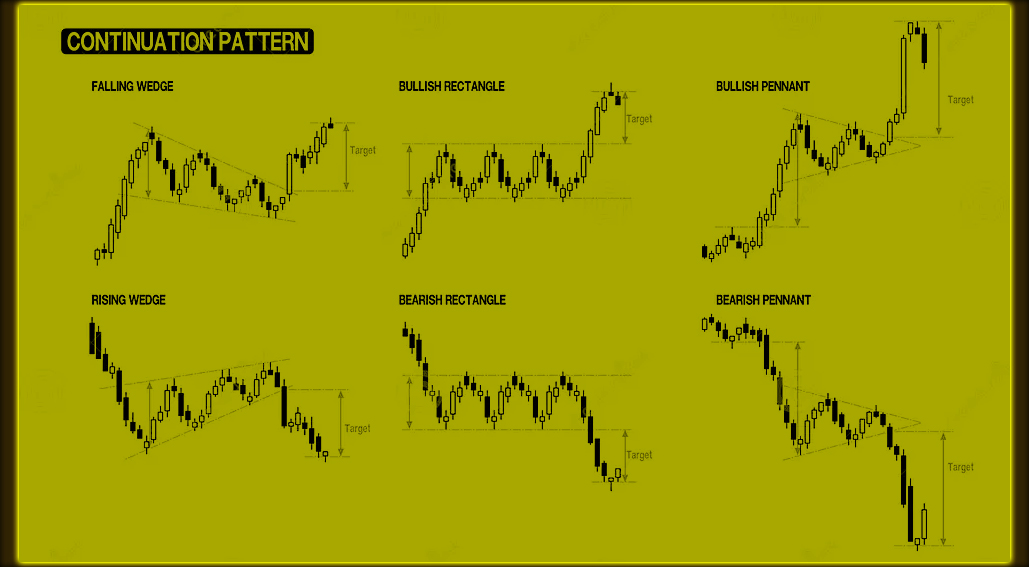
The falling wedge pattern is a technical analysis pattern that typically occurs within a downtrend and signifies a potential reversal of that trend. It is characterized by two converging trendlines: a descending resistance line and a shallower descending support line. The price movement within these lines creates a narrowing pattern resembling a wedge.


 Anatomy of a Falling Wedge Pattern

To grasp the falling wedge pattern, let's break down its key components:

1)  Resistance Trendline

The resistance trendline connects the lower swing highs within the pattern. It has a steeper descending slope compared to the support trendline.

2) Support Trendline

The support trendline connects the lower swing lows within the pattern. It slopes downward but at a shallower angle than the resistance trendline.

3) Gradual Convergence

One prominent feature of a falling wedge pattern is the gradual convergence of the two trendlines, leading to a narrowing price range.


Types of Falling Wedge Patterns

While the fundamental structure of a falling wedge pattern remains consistent, variations occur based on different timeframes and market conditions. Understanding these variations is vital for effective trading.

 1) Short-Term Falling Wedge

A short-term falling wedge pattern unfolds over a relatively brief period, often intraday or on shorter timeframes. Traders may use this pattern for short-term trading strategies.

2) Long-Term Falling Wedge

Conversely, a long-term falling wedge pattern develops over an extended period, such as weeks or months. It is particularly relevant for swing traders and investors looking at broader market trends.


Understanding Falling Wedge Pattern Price Action

Understanding the price action within a falling wedge pattern is essential for making well-informed trading decisions. Let's explore the price dynamics and key elements.


Formation Criteria

Before diving into price action, it's crucial to understand the formation criteria of a falling wedge pattern. These criteria provide the context for interpreting price movements.


 Multiple Touches

A valid falling wedge pattern typically features multiple touches on both the support and resistance trendlines. These touches confirm the pattern's validity and suggest that market participants recognize its significance.

Gradual Slope

While the slope of the trendlines within a falling wedge can vary slightly, a gradual slope is generally more reliable. An excessively steep slope may indicate an unsustainable trend.


Price Action within the Falling Wedge Pattern

Now, let's delve into the price action dynamics that occur within a falling wedge pattern:

1) Converging Trendlines

The most notable feature of a falling wedge pattern is the convergence of the support and resistance trendlines. These lines progressively approach each other, creating a narrowing price range that signifies potential price compression.

2)Lower Highs and Lower Lows

Within the falling wedge, you'll observe a sequence of lower highs and lower lows. These price movements reflect the tug-of-war between buyers and sellers:

  • Lower Highs: These points signify that sellers are prevailing, as the market fails to reach or exceed the previous high.
  • Lower Lows: These points represent a continuation of the downtrend, indicating that sellers are maintaining control.

3) Declining Volume

Another crucial aspect of falling wedge pattern price action is volume. As the pattern develops, trading volume typically decreases. This decline suggests diminishing market participation and is often seen as a precursor to a potential breakout.

  • Volume Analysis: Keep a close watch on volume levels. A pronounced decrease in volume within the pattern may serve as a cautionary signal, indicating that a breakout is impending.

4) Psychological Factors

Price action within a falling wedge pattern can also be influenced by psychological factors. Traders and investors are aware of the pattern's implications, which can lead to specific behaviors:

  • Anticipation: As the pattern approaches its apex (the point of convergence), traders become increasingly anticipatory. They recognize that a breakout is imminent and may position themselves accordingly.
  • Buyer Interest: Some traders may start accumulating positions near the support trendline in anticipation of a bullish breakout. This buying interest can contribute to a potential reversal.


 Interpretation and Potential Outcomes

Interpreting the price action within a falling wedge pattern involves assessing the balance of forces between buyers and sellers and anticipating potential outcomes:


Bullish Bias

Despite being formed within a downtrend, the falling wedge pattern often suggests a bullish bias:

  • Lower Highs and Lower Lows: The formation of lower highs and lower lows indicates a weakening downtrend and suggests a potential shift in sentiment.
  • Converging Trendlines: The convergence of the support and resistance trendlines signals that the price is experiencing a narrowing range, which could lead to a breakout.


Potential Outcomes

  • Bullish Breakout: The most common outcome of a falling wedge pattern is a bullish breakout. This occurs when the price breaks above the resistance trendline. Traders interpret this as a sign that the downtrend is losing momentum, and a potential reversal to the upside is underway.
  • False Breakout: Occasionally, the price may briefly breach the resistance trendline but then quickly reverse and return within the wedge pattern. This is known as a false breakout and can trap traders who entered long positions prematurely.
  • Continuation: In some instances, the price may break below the support trendline, signaling a continuation of the existing downtrend. However, this outcome is less common and often requires strong bearish catalysts.


How to Trade the Falling Wedge Pattern

Trading the falling wedge pattern effectively involves specific strategies and tactics to maximize potential profits while managing risks. Let's explore these strategies, including entry and exit points:

Trading the Bullish Breakout

When anticipating a bullish breakout based on the price action within a falling wedge pattern, consider the following strategies:

1) Entry Points

  • Confirmation: Wait for a confirmed breakout above the resistance trendline. Avoid entering long positions prematurely.
  • Limit Orders: Utilize limit orders to enter the market at a predetermined price level after the breakout.

2) Stop-Loss and Take-Profit Levels

  • Stop-Loss: Place stop-loss orders just below the breakout point to limit potential losses if the breakout proves to be false.
  • Take-Profit: Calculate potential price targets based on the width of the wedge pattern (the distance between the support and resistance trendlines). Consider taking partial profits as the price approaches these targets.


3) Risk Management

  • Position Size: Determine your position size based on your risk tolerance and the distance to your stop-loss.
  • Diversification: Avoid concentrating your risk in a single trade. Diversify your trading portfolio across different assets and strategies.


 Dealing with False Breakouts

False breakouts can occur and lead to losses. Here's how to manage them:

1) Wait for Confirmation

  • Confirmation Indicators: Use confirmation indicators such as volume and momentum oscillators to validate the authenticity of the breakout.

2) Be Patient

Avoid Impulsiveness: Exercise patience and avoid rushing into trades. A failed breakout may provide another opportunity to enter the market at a more favorable price.

 Best Indicator for Falling Wedge Pattern

Using the right indicators can significantly enhance your analysis and decision-making when trading the falling wedge pattern. Here are some of the best indicators to consider:

 1) Relative Strength Index (RSI)

The RSI is a momentum oscillator that measures the speed and change of price movements. It ranges from 0 to 100 and is particularly useful in identifying overbought and oversold conditions. When trading a falling wedge pattern, look for divergence between the RSI and the price action. Bullish divergence can be a strong signal of a potential bullish breakout.

2) Moving Averages

Moving averages smooth out price data to create a trend-following indicator. The 50-period and 200-period moving averages are commonly used to identify trend directions. In the context of a falling wedge pattern, a bullish crossover, where the shorter-term moving average crosses above the longer-term moving average, can provide additional confirmation of a bullish breakout.

 3) Volume

Volume is a critical indicator when trading the falling wedge pattern. As mentioned earlier, declining volume within the pattern can be a warning sign of an impending breakout. Pay close attention to volume surges during the breakout, as it can validate the strength and authenticity of the move.


Entry and Exit Points in Falling Wedge Pattern

Identifying the right entry and exit points is crucial when trading the falling wedge pattern. Here are some guidelines:

1) Entry Points

  • Confirm the Breakout: Wait for a confirmed breakout above the resistance trendline for a bullish entry. Avoid entering prematurely.
  • Use Limit Orders: Place limit orders slightly above the resistance trendline to enter the market at a predetermined price level once the breakout occurs.

2)  Exit Points

  • Take Partial Profits: As the price approaches potential targets (based on the width of the pattern), consider taking partial profits to secure gains while allowing the remainder of the position to run.
  • Adjust Stop-Loss: Adjust your stop-loss order to lock in profits as the trade moves in your favor. This helps protect against reversals.


Final Thought

The falling wedge pattern is a valuable tool for traders seeking to identify potential trend reversals or continuations within a downtrend. By understanding its structure, formation criteria, breakout strategies, and key indicators, you can make more informed trading decisions. Remember to implement risk management techniques, be cautious of false breakouts, and continuously refine your trading skills. With practice and dedication, you can harness the power of the falling wedge pattern to enhance your trading success and navigate the complex world of financial markets with confidence.

Read More
// // Leave a Comment

Mastering the Rising Wedge Pattern: Types, Trading Strategies, and Best Indicators

  Mastering the Rising Wedge Pattern in Trading

Mastering the Rising Wedge Pattern in Trading


In the world of technical analysis, the rising wedge pattern is a powerful tool for traders seeking to identify potential trend reversals and make informed decisions. This article is your comprehensive guide to understanding the rising wedge pattern, its types, and strategies for trading it effectively. We'll delve into the basics, explore various types, discuss key indicators, and provide practical insights for traders at all levels.


What is a Rising Wedge Pattern?

A rising wedge pattern is a technical analysis pattern that occurs within an uptrend and typically signals a potential trend reversal. This pattern is characterized by two converging trendlines: an upward-sloping support line and a steeper upward-sloping resistance line. As the price oscillates within these lines, it creates a narrowing formation resembling a wedge.


Anatomy of a Rising Wedge Pattern

To understand the rising wedge pattern, let's break down its key components:

A) Support Trendline

The support trendline connects the higher swing lows within the pattern. It slopes upward but at a less steep angle than the resistance trendline.

B) Resistance Trendline

The resistance trendline connects the higher swing highs within the pattern. It has a steeper upward slope compared to the support trendline.

C) Gradual Convergence

One distinctive feature of a rising wedge pattern is the gradual convergence of the two trendlines, creating a narrowing price range.

Types of Rising Wedge Patterns

While the basic structure of a rising wedge pattern remains the same, variations exist based on the timeframes and market conditions. Understanding these variations is essential for effective trading.

I) Short-Term Rising Wedge

A short-term rising wedge pattern occurs over a relatively brief period, such as intraday or on shorter timeframes. Traders often use this pattern for short-term trading strategies.

II) Long-Term Rising Wedge

Conversely, a long-term rising wedge pattern develops over an extended period, often spanning weeks or months. It is particularly relevant for swing traders and investors.


Understanding Rising Wedge Pattern Price Action

Understanding the price action within a rising wedge pattern is essential for traders looking to make informed decisions. In this section, we will explore the dynamics of rising wedge pattern price action and how to interpret it effectively.


Formation Criteria

Before delving into price action, it's crucial to review the formation criteria of a rising wedge pattern, as they provide context for its price behavior.

 A) Multiple Touches

One key characteristic of a valid rising wedge pattern is that both the support and resistance trendlines should have multiple touches. These touches indicate that market participants are acknowledging these levels as significant.

B)  Gradual Slope

While the slope of the trendlines within a rising wedge pattern can vary, a gradual slope is generally more reliable. An overly steep slope may signal an unsustainable trend.


 Price Action within the Rising Wedge Pattern

Now, let's delve into the price action dynamics that occur within a rising wedge pattern:


A) Converging Trendlines

The most conspicuous feature of a rising wedge pattern is the convergence of the support and resistance trendlines. These lines come together, creating a narrowing price range resembling a wedge. This narrowing range suggests a potential decrease in price volatility as the pattern progresses.


 B) Lower Highs and Higher Lows

Within the rising wedge, you'll observe a sequence of lower highs and higher lows. These fluctuations in price represent a tug-of-war between buyers and sellers.

  • Lower Highs: These are price points where the market fails to reach or exceed the previous high. It indicates that buyers are becoming less enthusiastic and that selling pressure may be building.
  • Higher Lows: These are price points where the market fails to reach or exceed the previous low. It suggests that sellers are losing momentum and that buying interest may still exist.


C) Declining Volume

Another critical aspect of rising wedge pattern price action is the volume. Typically, as the pattern develops, trading volume tends to decrease. This declining volume reflects a decrease in market interest and participation.

  • Volume Analysis: Pay close attention to volume levels. A sharp decrease in volume within the pattern is often seen as a cautionary signal. It implies that the market is in a state of uncertainty, and a breakout might be approaching.

D) Psychological Factors

The price action within a rising wedge pattern can also be influenced by psychological factors. Traders and investors are aware of the pattern's implications, which can lead to specific behaviors:

  • Caution: As the pattern progresses and the price approaches the apex (the point where the trendlines converge), traders become cautious. They are aware that a breakout is imminent and may hesitate to enter new positions.
  • Pressure to Breakout: Traders anticipating a breakout may exert pressure on the price. Those expecting a bullish breakout may start buying near the support trendline, while those expecting a bearish breakout may start selling near the resistance trendline.


 Interpretation and Potential Outcomes

Interpreting the price action within a rising wedge pattern involves assessing the balance of forces between buyers and sellers and anticipating potential outcomes:

A)  Bearish Bias

The overall price action and structural characteristics of a rising wedge pattern often suggest a bearish bias:

  • Lower Highs: The consecutive lower highs indicate weakening buying interest.
  • Narrowing Range: The converging trendlines signify a potential compression of price movement.
  • Declining Volume: Reduced trading volume hints at waning market enthusiasm.

B) Potential Outcomes

  • Bearish Breakout: The most common outcome of a rising wedge pattern is a bearish breakout. This occurs when the price breaks below the support trendline. Traders interpret this as a signal that the uptrend is losing momentum, and a potential reversal to the downside is underway.
  • False Breakout: Sometimes, the price may temporarily break below the support trendline but then quickly reverse and return within the wedge pattern. This is known as a false breakout and can trap traders who entered short positions prematurely.
  • Continuation: In some cases, the price may break above the resistance trendline, indicating a continuation of the existing uptrend. However, this outcome is less common and often requires strong bullish catalysts.


 Trading Strategies Based on Rising Wedge Price Action

Now that we've gained a deeper understanding of rising wedge pattern price action, let's explore trading strategies that leverage this knowledge:

Trading the Bearish Breakout

When anticipating a bearish breakout based on the price action within a rising wedge pattern, consider the following strategies:

A) Entry Points

  • Confirmation: Wait for a confirmed breakout below the support trendline. Avoid entering short positions prematurely.
  • Limit Orders: Utilize limit orders to enter the market at a predetermined price level after the breakout.


B) Stop-Loss and Take-Profit Levels

  • Stop-Loss: Place stop-loss orders just above the breakout point to limit potential losses if the breakout proves to be false.
  • Take-Profit: Calculate potential price targets based on the width of the wedge pattern (the distance between the support and resistance trendlines). Consider taking partial profits as the price approaches these targets.


Risk Management

  • Position Size: Determine your position size based on your risk tolerance and the distance to your stop-loss.
  • Diversification: Avoid concentrating your risk in a single trade. Diversify your trading portfolio across different assets and strategies.


Dealing with False Breakouts

False breakouts are common in trading and can lead to losses. Here's how to manage them:

Wait for Confirmation

  • Confirmation Indicators: Use confirmation indicators such as volume and momentum oscillators to validate the authenticity of the breakout.

Be Patient

  • Avoid Impulsiveness: Exercise patience and avoid rushing into trades. A failed breakout may provide another opportunity to enter the market at a more favorable price.

 How to Trade the Rising Wedge Pattern


Trading the rising wedge pattern requires a well-defined strategy and an understanding of potential breakout directions.


Breakout Direction

Determining the breakout direction is a critical aspect of trading the rising wedge pattern.

Bearish Breakout

A bearish breakout occurs when the price breaks below the support trendline of the rising wedge. Traders interpret this as a sign that the prevailing uptrend is losing momentum, and a potential reversal to the downside is underway.


Confirmation Indicators

To enhance the accuracy of your breakout prediction, consider using confirmation indicators:

Momentum Indicators: Indicators like the Relative Strength Index (RSI) or the Moving Average Convergence Divergence (MACD) can help confirm the strength of the breakout signal.

Volume: Look for an increase in trading volume during the breakout, as it can validate the authenticity of the breakout.

Trading Strategies

Trading the rising wedge pattern involves specific strategies to maximize potential profits while managing risks.

 Entry Points

  • Wait for a confirmed breakout: Avoid premature entries by waiting for the price to decisively break below the support trendline.
  • Set entry orders: Utilize limit orders to enter the market at a predetermined price level after a confirmed breakout.
  • Implement stop-loss orders: Protect your capital by placing stop-loss orders just above the breakout point to limit potential losses.
  • Consider trailing stop-loss: As the price moves in your favor, adjust your stop-loss to lock in profits while protecting against reversals.

Take-Profit Levels

  • Calculate price targets: Measure the width of the rising wedge pattern, which is the distance between the support and resistance trendlines.
  • Apply the width to the breakout point: For a bearish breakout, subtract the width from the breakout point to estimate the potential downside target.
  • Take partial profits: Consider scaling out of your position as the price approaches the target to secure some gains while allowing the remainder to run.

Risk Management

  • Effective risk management is essential when trading the rising wedge pattern:
  • Determine your position size based on your risk tolerance and the distance to your stop-loss.
  • Avoid risking more than a predetermined percentage of your trading capital on a single trade.
  • Diversify your trading portfolio to spread risk across different assets and strategies.

Best Indicator for Rising Wedge Pattern

While trading the rising wedge pattern, using the right indicators can significantly enhance your analysis and decision-making process.

 1) Relative Strength Index (RSI)

The RSI is a momentum oscillator that measures the speed and change of price movements. It ranges from 0 to 100 and is particularly useful in identifying overbought and oversold conditions. When trading a rising wedge pattern, look for divergence between the RSI and the price action. Bearish divergence can be a strong signal of a potential bearish breakout.

2) Moving Averages

Moving averages smooth out price data to create a trend-following indicator. Traders often use the 50-period and 200-period moving averages to identify trend directions. In the context of a rising wedge pattern, a bearish crossover, where the shorter-term moving average crosses below the longer-term moving average, can provide additional confirmation of a bearish breakout.

3) Volume

Volume is an essential indicator when trading the rising wedge pattern. As mentioned earlier, declining volume within the pattern can be a warning sign of an impending breakout. Pay close attention to volume surges during the breakout, as it can validate the strength and authenticity of the move.


Final Thought

The Rising wedge pattern is a valuable tool for traders seeking to identify potential trend reversals within an uptrend. By understanding its structure, formation criteria, breakout strategies, and key indicators, you can make more informed trading decisions. Remember to implement risk management techniques, be cautious of false breakouts, and continuously refine your trading skills. With practice and dedication, you can harness the power of the rising wedge pattern to enhance your trading success.

Read More
// // Leave a Comment

Mastering Wedge Chart Patterns: Trading Strategies and Type

A Comprehensive Guide to Wedge Chart Patterns in Trading


In the dynamic world of trading, technical analysis is a valuable tool that helps traders make informed decisions. Among the plethora of chart patterns, the wedge pattern stands out as a powerful indicator of potential trend reversals or continuations. Whether you're a seasoned trader or just starting, understanding the wedge chart pattern can significantly enhance your trading strategy. In this comprehensive guide, we will delve deep into the world of wedge patterns, from their definition and types to strategies for trading them effectively.


What is a Wedge Chart Pattern?

A wedge chart pattern is a technical analysis pattern that represents a temporary pause or consolidation within a prevailing trend. It is characterized by two converging trendlines, one sloping up (rising wedge) and the other sloping down (falling wedge). The price movement within these converging trendlines indicates potential future price action.

Types of Wedge Patterns

Wedge patterns can be broadly categorized into two main types, each with its own implications for traders:

1) Rising Wedge

A rising wedge is a bearish pattern that occurs during an uptrend. It is characterized by a sloping resistance line and a steeper sloping support line. As the price oscillates within these lines, it creates a narrowing pattern, suggesting that the uptrend is losing steam. Traders often see this as a warning sign of a potential trend reversal to the downside.

2) Falling Wedge

Conversely, a falling wedge is a bullish pattern found in a downtrend. It consists of a descending resistance line and a shallower sloping support line. The narrowing price movement within these lines indicates a potential breakout to the upside, signaling a reversal of the prevailing downtrend.


Understanding Wedge Pattern Price Action

I) Formation Criteria

To effectively identify and trade wedge patterns, it's essential to understand the criteria for their formation:

A) Trendlines

The foundation of a wedge pattern lies in the two converging trendlines. Here's how to correctly draw and interpret them:

  • Resistance Trendline: Connects the higher swing highs in a rising wedge or the lower swing highs in a falling wedge.
  • Support Trendline: Connects the lower swing lows in a rising wedge or the higher swing lows in a falling wedge.

For a valid wedge pattern, these trendlines should intersect at a specific point known as the apex. The slope of these trendlines is generally gradual but noticeable.

B) Multiple Touches

A robust wedge pattern typically features multiple touches on both the support and resistance trendlines. These touches confirm the validity of the pattern and suggest that market participants are paying attention to these levels.

C) Gradual Slope

While the slope of the trendlines can vary, a gradual slope is often considered more reliable. A steep slope may indicate a more aggressive trend, but it could also lead to false breakouts.

II. Volume

Volume analysis is a crucial component of trading wedge patterns. Typically, as the wedge pattern develops, trading volume tends to decrease. This decline in volume signifies decreasing market interest and can serve as a warning sign of an impending breakout.


How to Trade Wedge Chart Patterns

Now that we've covered the basics of wedge patterns let's explore strategies for trading them effectively.


Breakout Direction

Determining the breakout direction is crucial when trading wedge patterns. Here are some considerations:

A) Bullish Breakout

A bullish breakout occurs when the price breaks above the upper trendline of a falling wedge or the resistance trendline of a rising wedge. Traders interpret this as a sign that buyers are gaining control, and a potential uptrend is underway.

B) Bearish Breakout

Conversely, a bearish breakout happens when the price breaches the lower trendline of a rising wedge or the support trendline of a falling wedge. This suggests that sellers are taking control, and a potential downtrend may follow.

Confirmation Indicators

To enhance the accuracy of your breakout prediction, consider using confirmation indicators such as:

  • Momentum Indicators: Like the Relative Strength Index (RSI) or the Moving Average Convergence Divergence (MACD), these can help confirm the strength of the breakout.
  • Volume: An increase in trading volume during the breakout can validate its authenticity.
  • News and Events: Keep an eye on relevant news or events that might impact the asset you're trading.

 Wedge pattern Trading Strategies

Trading wedge patterns effectively requires a well-defined strategy. Here's a step-by-step approach:


A) Entry Points

Wait for a breakout confirmation: Avoid premature entries by waiting for the price to decisively break above or below the trendlines.

  • Set entry orders: Use limit orders to enter the market at a predetermined price level after a confirmed breakout.
  • Implement stop-loss orders: Protect your capital by placing stop-loss orders just below the breakout point for bullish trades and above the breakout point for bearish trades.
  • Consider using trailing stop-loss: As the price continues to move in your favor, adjust your stop-loss to lock in profits while minimizing losses.

B) Take-Profit Levels

  • Calculate price targets: Measure the distance between the widest points of the wedge pattern (the "width").
  • Apply the width to the breakout point: For bullish breakouts, add the width to the breakout point to estimate the potential upside target. For bearish breakouts, subtract it from the breakout point for the potential downside target.
  • Take partial profits: Consider scaling out of your position as the price approaches the target to secure some gains while allowing the remainder to run.

C)  Risk Management

  • Effective risk management is crucial when trading wedge patterns:
  • Determine your position size based on your risk tolerance and the distance to your stop-loss.
  • Never risk more than you can afford to lose on a single trade.
  • Diversify your trading portfolio to spread risk across different assets and strategies.

False Breakouts

False breakouts are common in trading, and wedge patterns are no exception. Recognizing and managing false breakouts is essential to avoid losses.


Identifying False Breakouts

A) Lack of Confirmation

One sign of a potential false breakout is a lack of confirmation from volume or other indicators. If the price breaks out, but trading volume remains low, it may not be a reliable breakout.

B) Whipsaw Price Action

Whipsaw price action refers to rapid, volatile movements immediately following a breakout. This can be a sign that the breakout lacks conviction.

C) Fakeout Breakouts

Fakeout breakouts occur when the price briefly moves beyond the trendlines but quickly reverses and returns within the wedge pattern.


Dealing with False Breakouts

A) Wait for Confirmation

To reduce the risk of trading false breakouts, wait for confirmation from multiple indicators, such as volume and momentum.

B) Use Stop-Loss Orders

Always use stop-loss orders to limit potential losses in case of a false breakout. Place these orders just beyond the trendlines to minimize the impact of whipsaw price action.

C) Be Patient

Exercise patience and avoid rushing into trades. A failed breakout may provide another opportunity to enter the market at a more favorable price.


Measuring Price Targets

Measuring price targets is a critical aspect of trading wedge patterns, as it helps determine the potential profit of a trade.


Using the Width of the Wedge Pattern

To estimate price targets, traders often use the width of the wedge pattern. Here's how:

  • Measure the widest part of the wedge pattern, which is the distance between the two trendlines at their farthest point.
  • Apply this width to the breakout point in the direction of the breakout.

A) Bullish Breakout

For a bullish breakout, add the width to the breakout point. This gives you an estimate of the potential upside target.

B) Bearish Breakout

For a bearish breakout, subtract the width from the breakout point. This provides an estimate of the potential downside target.

C) Alternative Methods

While using the width of the wedge pattern is a common method, some traders prefer alternative approaches, such as Fibonacci retracement levels, to determine price targets.


Trading Psychology

Successful trading isn't just about technical analysis; it also involves managing your emotions and psychology.

Emotions in Trading

Trading can evoke powerful emotions, including fear and greed. These emotions can lead to impulsive decisions, which can be detrimental to your trading account.

A) Fear

Fear can cause traders to second-guess their strategies, exit profitable trades prematurely, or avoid trading opportunities altogether due to a fear of losses.

B)  Greed

Greed can lead to overtrading, taking excessive risks, or not sticking to a trading plan. Traders driven by greed may chase profits and ignore risk management.


Sticking to a Trading Plan

One of the most effective ways to manage emotions in trading is to have a well-defined trading plan and stick to it:

  • Set clear entry and exit criteria.
  • Establish risk-reward ratios for each trade.
  • Implement stop-loss and take-profit orders as planned.
  • Avoid impulsive decisions based on emotions.


Back testing and Analysis

To become a proficient trader of wedge patterns, it's essential to analyze historical data and backtest your strategies.

1) Historical Analysis

Examine historical price charts to identify wedge patterns and their outcomes. This helps you gain a deeper understanding of how these patterns behave in different market conditions.

2) Tweaking Strategies

Based on your historical analysis, consider tweaking your trading strategies. Adjust your entry and exit criteria, risk management rules, and other parameters to improve your trading performance.


Market Conditions

The broader market context plays a significant role when trading wedge patterns.

A) Trend Analysis

Consider the overall trend in the market. Trading in the direction of the prevailing trend can enhance the reliability of wedge pattern signals.

B)  Economic Events and News

Pay attention to economic events and news releases that can impact the asset you're trading. Sudden market-moving events can influence the breakout direction and pattern reliability.


Continuous Learning

The world of trading is ever-evolving. To stay ahead, make continuous learning a part of your trading routine.

A) Stay Informed

Stay updated with the latest developments in the financial markets, trading strategies, and technical analysis tools.

B) Practice and Adapt

Regularly practice your trading strategies and be willing to adapt to changing market conditions. What works in one market environment may not work in another.


Final Thought

Wedge chart pattern is a valuable tool in a trader's arsenal for analyzing potential trend reversals or continuations. By understanding the types of wedge patterns, their formation criteria, and effective trading strategies, you can improve your ability to make informed trading decisions. Remember to employ risk management techniques, be mindful of false breakouts, and manage your emotions while continuously learning and adapting to the ever-changing world of trading. With dedication and practice, you can harness the power of wedge patterns to enhance your trading success.

Read More

Trending